
Overview and Key Points
Consumer behavior has shifted following the COVID-19 pandemic from services consumption to goods. Consumer demand for durable goods skyrocketed as high savings rates and large fiscal stimulus packages enabled the fastest durable goods rebound on record—something global and domestic supply chains were not prepared for. This combination of surging consumer spending along with numerous supply-chain limitations leads us to explore how exactly the supply-chain mess unfolded and how prevalent these issues may be in 2022.
- Impact of the COVID-19 recession – Economic and social restrictions, coupled with immense fiscal support, paved the way for significant consumer spending on durable goods.
- Supply-chain limitations exposed – Globally, corporations’ push for increased profits has led to a complex supply chain that is brittle in some spots and unable to handle the surge in global goods demand.
- The perfect storm: Los Angeles/Long Beach ports (LA/LB) – US domestic supply-chain issues have been most prevalent in the ports of LA and LB. A combination of domestic supply-side issues, including a shortage of truck drivers, warehouse space and dock space, have amplified global issues caused by durable goods demand.
- Normalization is slowly beginning, but risks remain – Recent data reveal some tentative easing of supply-chain conditions; however, normalization is unlikely until the second half of 2022 with a variety of risks.
- Multi-asset implications – Supply-chain problems are primarily due to increased demand, which is supportive of growth-oriented assets like equities and credit. One risk we are monitoring is margin pressures. We prefer short-duration fixed income exposure and are monitoring how central bank policy evolves amidst the current elevated levels of inflation.
The Supply-Chain Catalyst: A Unique Recession, Policy Response, and Recovery
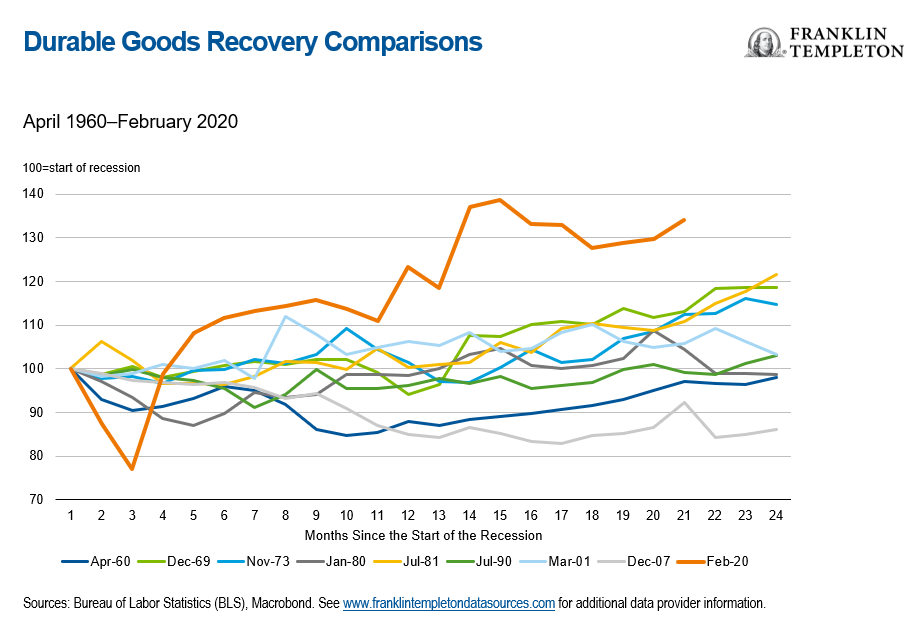
The global COVID recession was record-breaking in its magnitude and brevity. The fiscal stimulus response to the COVID-19 pandemic was staggering. Worldwide, the fiscal stimulus response reached approximately 15% of global gross domestic product (GDP) in 2020, according to the International Monetary Fund. As a result of this stimulus, and along with higher savings rates, households held a surprising amount of spending power. As limited mobility and economic restrictions persisted, consumer spending across the world shifted away from COVID-sensitive services into durable goods. The ease and continued prevalence of online shopping further contributed to the surging levels of durable goods purchases, especially in the United States (see Exhibit 1).
Exhibit 1: US durable goods spending recovered faster than any post-recessionary period since WWII.
The Complexities of Global Trade
An increasing focus on business profits has led to outsourced production and a focus on “just-in-time” inventory management systems that feature very little slack. This resulted in a global trade and supply-chain system that had become increasingly complex prior to COVID. The system was engineered to thrive in normal economic environments but was clearly unable to deal with the volatile demand surge we observed post-COVID.
In the United States, one key focal point for supply chains is the ports of LA/LB. The LA/LB supply chain debacle represents a confluence of global and domestic factors; these ports function as the key gateway for imported goods produced in Asia and suffer from weak surrounding infrastructure.
Supply-Chain Limitations Exposed
In the most recent COVID rebound, several key stress points have emerged:
- COVID-related production shutdowns: Globalization has pushed production for certain goods into specific areas that have been susceptible to COVID-related shutdowns. China’s zero-COVID policy is a particular consideration.
- Semiconductors: Semiconductors play a vital role in manufacturing many goods, especially autos. Semiconductor manufacturing is a specialized process, with 75% taking place in East Asia, and advanced manufacturing taking place exclusively in South Korea and Taiwan.1 It can take years to add capacity, rather than months, which has made it hard to instantaneously respond to rising goods demand.
In the United States, roughly 40% of all US imports2 transit through the ports of LA/LB; there are several issues on the supply side that are exacerbating these ports’ ability to unload and transport incoming durable goods.
- Truck drivers: The American Trucking Association estimates that the United States is currently lacking about 80,000 drivers.3 Long hours and undesirable working conditions continue to push truck drivers toward other professions, so retention continues to deteriorate. In California alone, there are 640,445 people who hold active Class A and Class B commercial driver’s licenses, according to the Department of Motor Vehicles. However, there are only 140,000 “truck transportation” jobs in the state.4 Essentially, the truck driver “shortage” is a shortage of willing participants rather than a shortage of qualified drivers.
- Warehouse space: Given the shortage of truck drivers, warehouses are stocked with filled containers awaiting transportation, which has caused a warehouse crunch across southern California where vacancies hover around 1%.5 A related issue caused by the shortage of truck drivers and full warehouses is that there is nowhere to store the empty containers.
- Full and empty containers: Containers remain lingering on docks because they can’t be moved out of warehouses fast enough due to the shortage of truck drivers. With nowhere to store the full and empty containers, the dock areas are being used for container storage. This has led to ships unloading much more slowly than usual due to so many full and empty containers taking up valuable space on docks. Within the last month, there have been upwards of 90 ships waiting offshore of LA/LB as operations struggle to meet surging consumer demand.6
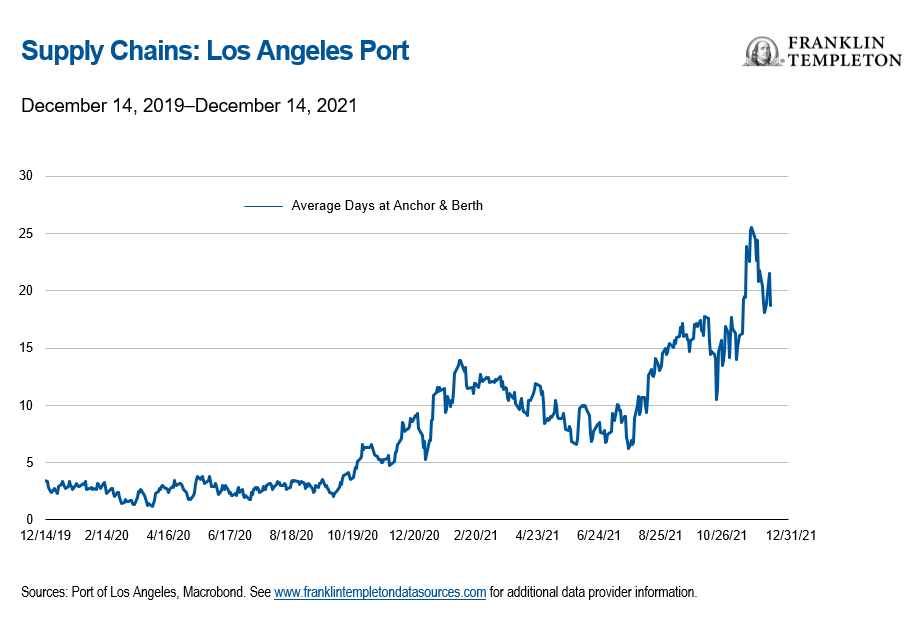
The above points highlight the interconnectedness of truck drivers, warehouse capacity, the lifecycle of containers, and sufficient dock space—all have worked together to amplify the backlog of ships waiting to enter the ports (see Exhibit 2). To some observers this may not be a surprising development. The Container Port Performance Index, created by the World Bank and IHS Markit, ranks 351 ports based off two different approaches. According to either method, both LA and LB rank in the bottom 25 of the index, and no US port ranked in the top 50.7
Exhibit 2: Ships are spending much more time at the port
(Some) Normalization Is Already Beginning to Occur
Supply-chain bottlenecks were prevalent in 2020-2021 and will likely persist well into 2022. However, there are a few tentative signs that the worst may soon be behind us.
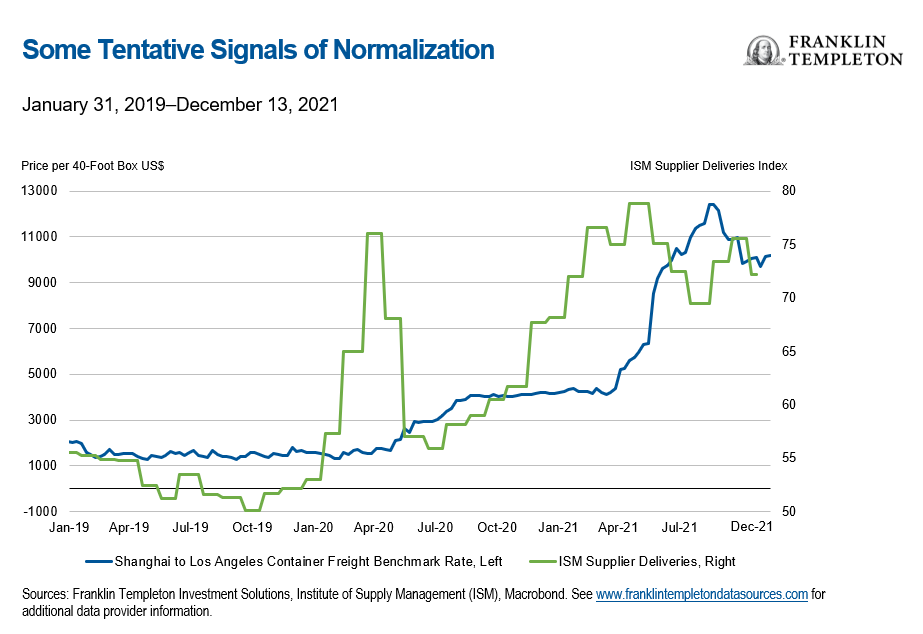
- Declining Global Freight Rates: Trans-Pacific freight rates have cooled recently as most large US retailers have already imported what they need for the holiday season. For example, on the Shanghai-to-Los Angeles route, the rate for a 40-foot container has declined by over 18% since the peak in September and is currently at the lowest level since July (see Exhibit 3).
- Weak Buying Conditions are Limiting Goods Demand: Surveys in the United States that measure consumer attitudes towards buying conditions for durable goods have plummeted, signifying the negative impact of higher prices on final demand.
- US Supplier Delivery Times Improving: The US Supplier Delivery Index for manufacturing has declined from an index high of 78.8 in May 2021 to 72.2 in November, highlighting faster delivery times.
- Empty containers are being removed faster: Since the LA and LB ports announced the potential for fines on ocean carriers who fail to clear empty containers off the docks in October, the number of containers sitting on the docks has dropped by 47%.8
Some of these signals reflect seasonality. Many large US retailers imported goods earlier than usual this year to get ready for the holiday shopping boom. Seasonality may continue to help ease supply chain constraints, especially with the upcoming Chinese New Year. Chinese policymakers shut down many factories for a week in February, which will slow output and perhaps provide a much-needed break on more ships and cargo flowing into US ports, as capacity is significantly reduced. Lower supply of goods is unlikely to be helpful for prices, however.
Exhibit 3: Some tentative signals of normalization
Risks Will Still Be Prevalent in 2022
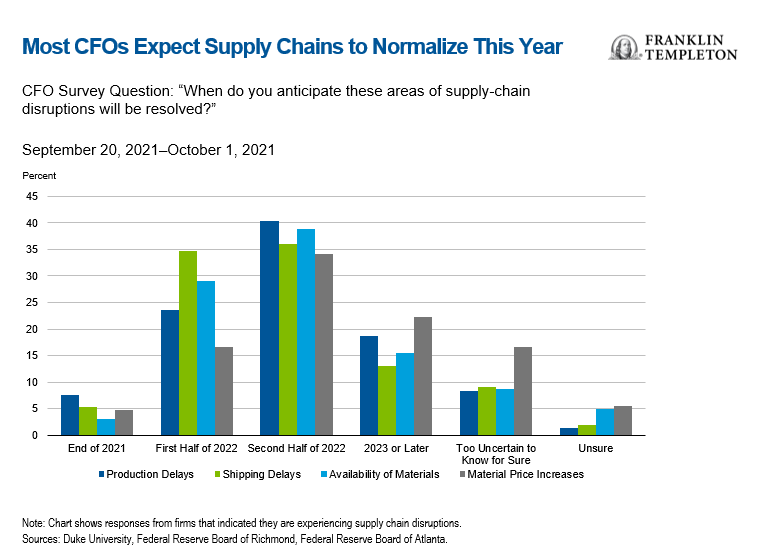
A survey in the third quarter of this year showed that most chief financial officers expect supply-chain disruptions to be resolved in the second half of 2022 (see Exhibit 4). We think this is a reasonable assumption, although there are many risks that may affect supply chains in 2022.
Exhibit 4: CFO expectations for supply-chain resolution
Globally, households still hold excess savings which could prolong the demand for durable goods. This demand is evident as many businesses face the lowest inventory-to-sales ratios9 since 2011. Any increase in restrictions and reduced mobility may limit the shift from goods to services consumption.
In the United States, shortages of truck drivers and warehouse workers will likely continue to be a drag on delivery times. The labor shortages could also grow in 2022 given the Pacific Maritime Association’s contracts with the International Longshore and Warehouse Union are expiring next summer.10 The last time contracts were discussed in 2014, West Coast ports faced months of slowdowns that were ultimately resolved when the White House became involved.11
In our view, all these risks will be obstacles to a quick recovery in the supply chain; however, the ending of the US and Chinese holiday season and the waning effects of previous fiscal stimulus should provide the framework for the supply-chain backlog easing during the first half of 2022, and eventually normalizing before year end.
Multi-Asset Implications
The most important consideration for determining portfolio implications is whether supply-chain and inflation issues are caused by demand or supply. Our analysis suggests that above-average demand for durable goods is the predominant cause of supply-chain and inflation problems. Demand-driven inflation can be supportive of risky assets like equities and high yield credit since higher demand raises both revenues and costs. So far, margins have held up nicely in 2021, and have even risen in most cases.
Federal Reserve (Fed) policy could pose additional risk to multi-asset portfolios as we enter 2022. Supply-chain issues have increased inflation and inflation volatility. The inflation outlook remains uncertain and consequently, the Fed will need to have a light touch on policy as it balances the improvements in the US labor market with the current elevated levels of inflation.
For now, we continue to prefer a more risk-on stance in portfolios by favoring equities along with some portions of credit. We remain underweight duration. We will be monitoring corporate margins and consumer spending as we head into 2022. We are also monitoring the evolution in Fed policy as it can have broad influence over multi-asset portfolios.
What Are the Risks?
All investments involve risks, including possible loss of principal. The value of investments can go down as well as up, and investors may not get back the full amount invested. Stock prices fluctuate, sometimes rapidly and dramatically, due to factors affecting individual companies, particular industries or sectors, or general market conditions. Bond prices generally move in the opposite direction of interest rates. Thus, as the prices of bonds adjust to a rise in interest rates, the share price may decline.
Important Legal Information
This material is intended to be of general interest only and should not be construed as individual investment advice or a recommendation or solicitation to buy, sell or hold any security or to adopt any investment strategy. It does not constitute legal or tax advice. This material may not be reproduced, distributed or published without prior written permission from Franklin Templeton.
The views expressed are those of the investment manager and the comments, opinions and analyses are rendered as at publication date and may change without notice. The underlying assumptions and these views are subject to change based on market and other conditions and may differ from other portfolio managers or of the firm as a whole. The information provided in this material is not intended as a complete analysis of every material fact regarding any country, region or market. There is no assurance that any prediction, projection or forecast on the economy, stock market, bond market or the economic trends of the markets will be realized. The value of investments and the income from them can go down as well as up and you may not get back the full amount that you invested. Past performance is not necessarily indicative nor a guarantee of future performance. All investments involve risks, including possible loss of principal.
Any research and analysis contained in this material has been procured by Franklin Templeton for its own purposes and may be acted upon in that connection and, as such, is provided to you incidentally. Data from third party sources may have been used in the preparation of this material and Franklin Templeton (“FT”) has not independently verified, validated or audited such data. Although information has been obtained from sources that Franklin Templeton believes to be reliable, no guarantee can be given as to its accuracy and such information may be incomplete or condensed and may be subject to change at any time without notice. The mention of any individual securities should neither constitute nor be construed as a recommendation to purchase, hold or sell any securities, and the information provided regarding such individual securities (if any) is not a sufficient basis upon which to make an investment decision. FT accepts no liability whatsoever for any loss arising from use of this information and reliance upon the comments, opinions and analyses in the material is at the sole discretion of the user.
Products, services and information may not be available in all jurisdictions and are offered outside the U.S. by other FT affiliates and/or their distributors as local laws and regulation permits. Please consult your own financial professional or Franklin Templeton institutional contact for further information on availability of products and services in your jurisdiction.
Issued in the U.S. by Franklin Distributors, LLC, One Franklin Parkway, San Mateo, California 94403-1906, (800) DIAL BEN/342-5236, franklintempleton.com – Franklin Distributors, LLC, member FINRA/SIPC, is the principal distributor of Franklin Templeton U.S. registered products, which are not FDIC insured; may lose value; and are not bank guaranteed and are available only in jurisdictions where an offer or solicitation of such products is permitted under applicable laws and regulation.
CFA® and Chartered Financial Analyst® are trademarks owned by CFA Institute.
___________________________
1. Source: Semiconductor Industry Association, Boston Consulting Group. (2021). “Strengthening the Global Semiconductor Supply Chain in an Uncertain Era.”
2. Source: A. Saraiva, B. Murray. “Every Step of the Global Supply Chain is Going Wrong – All at Once,” Bloomberg, November 23, 2021.
3. Source: American Trucking Associations. “Industry Short 80,000 Drivers Today, May Be Short 160,000 by 2030,” October 25, 2021.
4. Source: A. Semuels. “The Truck Driver Shortage Doesn’t Exist. Saying There Is One Makes Conditions Worse For Drivers,” Time, November 12, 2021.
5. Source: A. Saraiva, B. Murray. “Every Step of the Global Supply Chain is Going Wrong – All at Once,” Bloomberg, November 23, 2021.
6. Source: S. Stamm. R. Simon. A. Hufford. I. Pacheco. “Stuck at Port for 54 Days: How One Ship’s Delays Hurt Small Businesses,” The Wall Street Journal, December 7, 2021.
7. Source: World Bank. IHS Markit. The Container Port Performance Index 2020.
8. Source: The Port of Los Angeles. “‘Container Dwell Fee’ To Remain On Pause Until Dec. 20,” December 13, 2021.
9. “The inventories to sales ratios show the relationship of the end-of-month values of inventory to the monthly sales. These ratios can be looked at as indications of the number of months of inventory that are on hand in relation to the sales for a month.” – Source: Federal Reserve Bank of St. Louis. A low inventory-to-sales ratio indicates higher demand than supply of goods.
10. Source: A. Saraiva. “West Coast Ports, Dockworkers Face 2022 Clash Amid Port Snarls,” Bloomberg, November 1, 2021.
11. Source: A. Saraiva. “West Coast Dockworkers Reject Contract Extension, Seek Talks,” Bloomberg, November 23, 2021.