
The European Union’s plans for a phased ban on Russian oil imports leaves a sizeable hole in global supply. This comes as price inflation has kept crude above US$100/barrel in a world seeking to end its reliance on Russian oil. Energy executives and analysts, highlighting anxiety over supply risks, had already noted in the weeks following bans by the United States and United Kingdom that more than 1 million barrels a day of Russian crude exports had “gone missing” as some tankers went dark—possibly avoiding radar systems to skirt sanctions. That amount may even soon double, they added, as major oil importing economies such as India and China snap up discounted supplies.1
Even with the historic release of 1 million barrels of oil per day from US strategic petroleum reserves—an effort to tamp down gas prices and combat inflation—longer-term fears over production shortfalls and lofty crude prices persist. Underlying oil profits are impacted not only by expenses such as capital spending on infrastructure, transportation costs, taxes and royalties, but also by complexities like long operational ramp up times, Organization of Petroleum Exporting Countries (OPEC)2 output and demand uncertainties (think China).
So, what should investors pay attention to in trying to leverage oil gains? First of all, profits vary widely across countries, partly due to the levels of difficulties or ease of extraction from different types of oil fields. But even when oil prices are high and breakeven prices are low, there are a host of other considerations for those seeking to home in on energy market bets.
Breaking down breakevens
Variations in distinct methods of oil extraction—such as conventional, offshore, Arctic drilling, shale oil fracking and the energy-intensive work of separating heavy crude from oil sands—result in differing exploration and production costs and therefore factor into an oil producer’s breakeven price, also referred to as its technical breakeven.
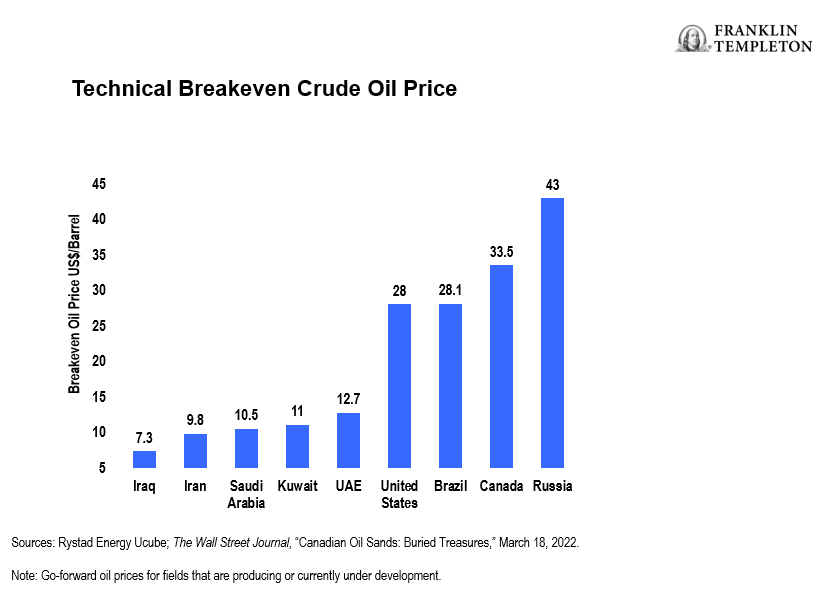
An oil-producing nation’s “fiscal breakeven” point, on the other hand, is the minimum per-barrel price required for the economy to meet its expected spending and balance its budget. This is typically distinguished from an “external breakeven” point, which is calculated by looking at the oil price that clears a country’s current account.
Crude calculations
The United States is both a top oil-producing country as well one of the world’s primary consumers. In 2019, it notably became a net exporter of crude, owing in part to increased shale oil field activity.3 According to a March survey by the Federal Reserve Bank of Dallas, West Texas Intermediate (WTI)—a light, sweet crude oil that serves as one of the main global oil benchmarks—needs to average just US$56 a barrel in order for US producers to breakeven.4
Thus far this year, soaring revenues from public exploration and production (E&P) companies are fueling a boom in tax revenues with upstream sector payments to governments set to reach an all-time high of US$2.5 trillion, according to research firm Rystad Energy.5 While Saudi Arabia and the United States have the highest revenues and notable increases from 2021, the government taxes collected vary considerably between nations. Norway and Iraq, for example, see an average take per produced barrel of oil equivalent (BOE) of approximately US$100, while the United States and Canada fetch below US$20 per BOE.6
Even if you set aside the Russia factor, there are many considerations for investors aiming to capture oil gains through dedicated allocation. Most direct trading of oil utilizes futures and options contracts in derivative markets, which can be risky and not particularly practical for most investors. For those seeking to diversify their portfolios with indirect exposure to oil producers, we believe single-country exchange-traded funds (ETFs) are cost-effective tools that can help tap exposure to some of the world’s major energy markets. To that end, here are some country scenarios to consider:
Opportunities by country
Saudi Arabia
Petrostates like Saudi Arabia have the advantage of large conventional oil fields that lie near the surface of the desert. This allows Persian Gulf state-controlled behemoths to pump a barrel of oil at lower costs compared to other areas. Saudi Arabia’s share of global oil investments has risen from around a third in the early 2000s to more than half.7 Its reserves are also among the least carbon-intensive to develop. Higher oil prices and this OPEC+ 8 leader’s reluctance to increase oil production have benefited it. While Saudi Arabia’s state-backed oil giant marked the world’s largest initial public offering when it listed in December 2019, investors were able to purchase just 1.5% of the company. The vast majority of Saudi Arabia’s oil giant is owned by the Kingdom, and oil revenues help bolster many other sectors such as infrastructure and banking. For the first quarter of 2022, Saudi Arabia’s gross domestic product expanded 9.6%, according to preliminary government data released in early May. Should the estimates be confirmed, the growth rate, driven by the oil sector recovery, would mark the highest increase since 2011, the Saudi General Authority for Statistics said.9 Beyond energy, Saudi Arabia has made a concerted push to diversify its exports and investment potential in tourism and other non-oil areas.
Canada
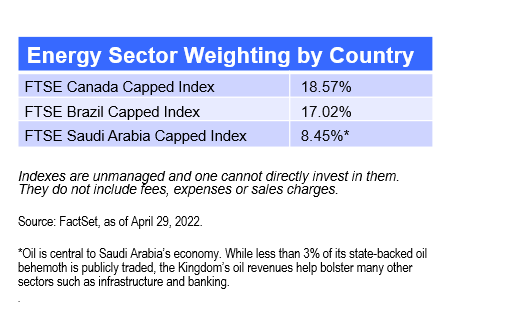
Energy is the FTSE Canada Capped Index’s second-largest sector at approximately 18%.10 To help improve global energy security, Canada’s natural resources minister recently announced the country has the capacity to increase the supply of its largest export, crude oil, by up to 300,000 barrels per day by the end of 2022. Most of Canada’s production growth comes from remote oil sands deposits in its energy-rich province of Alberta. However, it also has some of the industry’s highest capital costs, longest development timelines and significant resistance from environmentalists and First Nation advocates. Canada’s oil sands are among the largest reserves in the world after Saudi Arabia, and the country also produces crude oil from conventional, shale and deep-water Atlantic wells (albeit at declining amounts). Meanwhile, Canada has pledged, alongside climate change allies, to advance its energy transition in line with global climate commitments.
Brazil
The energy sector comprises approximately 17% of the FTSE Brazil RIC Capped Index.11 Brazil’s pre-salt region includes some of the world’s largest remaining oil fields, which are located deep underwater and involve challenging reservoirs. The country’s major oil entities have done well this year, profiting from extractions of high-quality crude from such rich offshore, deep-sea fields. Analysts point to impressive production efficiencies and the potential for international investment to drive significant expansion. Considering the country’s high-stakes presidential election is still months away, political uncertainty could threaten the sustainability of recent regulatory changes that aid oil and gas producers.
What Are the Risks?
All investments involve risks, including the possible loss of principal. The value of investments can go down as well as up, and investors may not get back the full amount invested. Stock prices fluctuate, sometimes rapidly and dramatically, due to factors affecting individual companies, particular industries or sectors, or general market conditions. Investments in foreign securities involve special risks including currency fluctuations, economic instability and political developments. Investments in emerging markets, of which frontier markets are a subset, involve heightened risks related to the same factors, in addition to those associated with these markets’ smaller size, lesser liquidity and lack of established legal, political, business and social frameworks to support securities markets. Because these frameworks are typically even less developed in frontier markets, as well as various factors including the increased potential for extreme price volatility, illiquidity, trade barriers and exchange controls, the risks associated with emerging markets are magnified in frontier markets. To the extent a strategy focuses on particular countries, regions, industries, sectors or types of investment from time to time, it may be subject to greater risks of adverse developments in such areas of focus than a strategy that invests in a wider variety of countries, regions, industries, sectors or investments. Investing in the natural resources sector involves special risks, including increased susceptibility to adverse economic and regulatory developments affecting the sector.
ETFs trade like stocks, fluctuate in market value and may trade above or below the ETF’s net asset value. Brokerage commissions and ETF expenses will reduce returns. ETF shares may be bought or sold throughout the day at their market price on the exchange on which they are listed. However, there can be no guarantee that an active trading market for ETF shares will be developed or maintained or that their listing will continue or remain unchanged. While the shares of ETFs are tradable on secondary markets, they may not readily trade in all market conditions and may trade at significant discounts in periods of market stress.
Important Legal Information
This material is intended to be of general interest only and should not be construed as individual investment advice or a recommendation or solicitation to buy, sell or hold any security or to adopt any investment strategy. It does not constitute legal or tax advice. This material may not be reproduced, distributed or published without prior written permission from Franklin Templeton.
The views expressed are those of the investment manager and the comments, opinions and analyses are rendered as at publication date and may change without notice. The underlying assumptions and these views are subject to change based on market and other conditions and may differ from other portfolio managers or of the firm as a whole. The information provided in this material is not intended as a complete analysis of every material fact regarding any country, region or market. There is no assurance that any prediction, projection or forecast on the economy, stock market, bond market or the economic trends of the markets will be realised. The value of investments and the income from them can go down as well as up and you may not get back the full amount that you invested. Past performance is not necessarily indicative nor a guarantee of future performance. All investments involve risks, including possible loss of principal.
Any research and analysis contained in this material has been procured by Franklin Templeton for its own purposes and may be acted upon in that connection and, as such, is provided to you incidentally. Data from third party sources may have been used in the preparation of this material and Franklin Templeton (“FT”) has not independently verified, validated or audited such data. Although information has been obtained from sources that Franklin Templeton believes to be reliable, no guarantee can be given as to its accuracy and such information may be incomplete or condensed and may be subject to change at any time without notice. The mention of any individual securities should neither constitute nor be construed as a recommendation to purchase, hold or sell any securities, and the information provided regarding such individual securities (if any) is not a sufficient basis upon which to make an investment decision. FT accepts no liability whatsoever for any loss arising from use of this information and reliance upon the comments, opinions and analyses in the material is at the sole discretion of the user.
Products, services and information may not be available in all jurisdictions and are offered outside the U.S. by other FT affiliates and/or their distributors as local laws and regulation permits. Please consult your own financial professional or Franklin Templeton institutional contact for further information on availability of products and services in your jurisdiction.
Issued in the U.S. by Franklin Distributors, LLC, One Franklin Parkway, San Mateo, California 94403-1906, (800) DIAL BEN/342-5236, franklintempleton.com – Franklin Distributors, LLC, member FINRA/SIPC, is the principal distributor of Franklin Templeton U.S. registered products, which are not FDIC insured; may lose value; and are not bank guaranteed and are available only in jurisdictions where an offer or solicitation of such products is permitted under applicable laws and regulation.
CFA® and Chartered Financial Analyst® are trademarks owned by CFA Institute.
_________
1. Source: Reuters, “No let off to oil prices as Russia barrels disappear from market, BP CEO says,” May 3, 2022.
2. OPEC is an intergovernmental organization with 13 current members: Algeria, Angola, Equatorial Guinea, Gabon, Iran, Iraq, Kuwait, Libya, Nigeria, the Republic of the Congo, Saudi Arabia, the United Arab Emirates and Venezuela.
3. Source: The Financial Times, “US is net exporter of oil for first time in decades,” November 29, 2019.
4. Source: Federal Reserve Bank of Dallas, Energy Survey, March 2022.
5. Source: Rystad Energy Press Release, “Blockbuster year for public E&Ps as profits set to soar to $834 billion in 2022, smashing record,” May 3, 2022.
6. Source: Rystad Energy, “High Oil and Gas Prices Provide Trillions of Dollars in Tax,” April 27, 2022.
7. Source: The Economist, “Can big oil’s bounce-back last?” January 12, 2022.
8. OPEC members and select allies.
9. Source: Reuters, “Saudi Arabia’s economy estimated to grow 9.6% in Q1, driven by oil,” May 1, 2022.
10. Source: FactSet, as of April 29, 2022. Indexes are unmanaged and one cannot directly invest in them. They do not include fees, expenses or sales charges.
11. Ibid.