

Originally published in Stephen Dover’s LinkedIn Newsletter Global Market Perspectives. Follow Stephen Dover on LinkedIn where he posts his thoughts and comments as well as his Global Market Perspectives newsletter.
While the current debt ceiling negotiations are creating near-term volatility across the capital markets, the issue of rising national indebtedness is a long-term story, with potentially long-run implications.
Rather than speculate on how the near-term politics will play out, we believe it is more important to explore the root causes of high levels of government debt and what that may mean for growth, inflation and other fundamentals impacting asset prices in the long term. Specifically, what accounts for the explosion of national government indebtedness over the past 15 years? Is the root cause surging expenditures or falling tax revenues, or both? How does the federal government collect taxes and what accounts for its spending? Is there precedent for reducing government indebtedness and, if so, what are the likely implications for the economic fundamentals?
Why has US debt risen so fast?
Since 2007, US federal government debt—whether expressed in dollars or as a percentage of US gross domestic product (GDP)—has mushroomed. At the end of 2007, on the eve of the global financial crisis (GFC), the size of US federal government debt was US$9.2 trillion, or 62.7% of GDP. A decade and a half later, at year-end 2022, total federal government debt had reached US$31.4 trillion, or 120.2% of GDP.1
While the United States has run persistent budget deficits over the past decade and a half, two major events—the GFC of 2008-2009 and the pandemic of 2020-2021—massively increased the size of US budget deficits.
Exhibit 1: US federal government spending and revenues as percentage of GDP 1968-2033 (right click to enlarge)
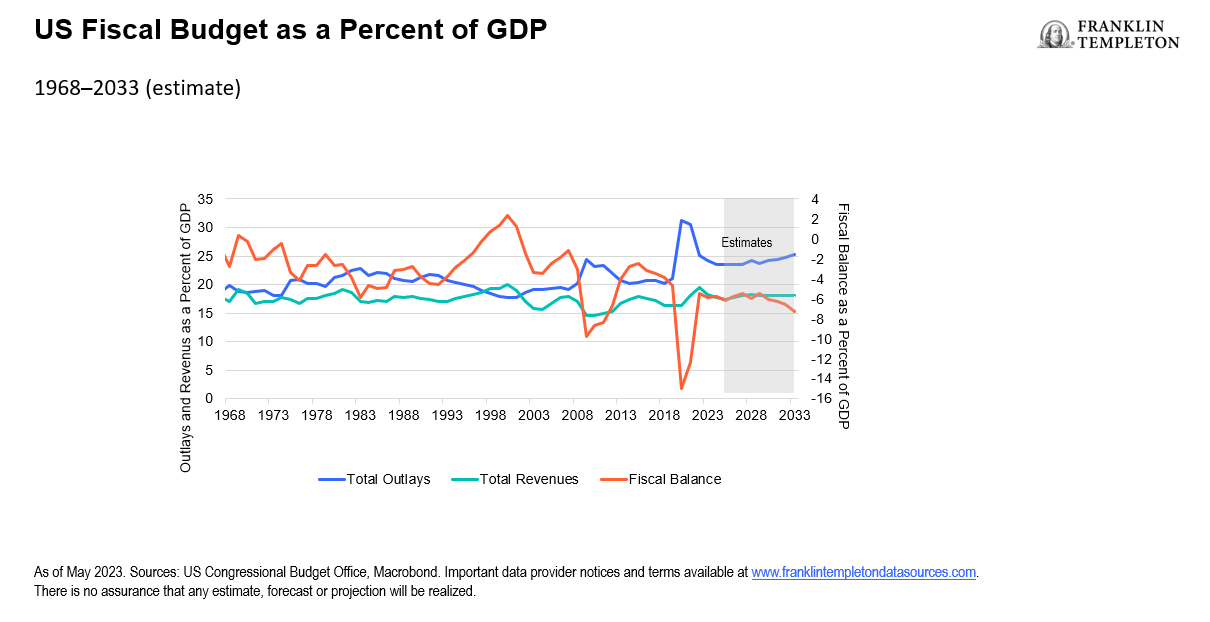
Of the total increase in US federal government indebtedness that has occurred since 2007 (namely, US$22.3 trillion), 63% of that amount accrued because of the budget deficits that emerged in the wake of the GFC and pandemic combined.2 Put differently, if we imagine a world where the GFC and pandemic had never occurred, plausible estimates would suggest today’s level of US federal government indebtedness relative to GDP would be below 100%, rather than today’s 120%.3
The large increase in deficits is associated with the GFC and pandemic shocks, due to both rising expenditures and falling tax revenues. However, during the GFC episode, increases in spending and falling tax revenues roughly contributed equally to the resultant budget deficit, whereas during the pandemic, higher government spending dominated the outcome. It is also evident that falling government expenditures and rising government tax revenues (as a percentage of GDP) since 2021 have led to a rapid and significant narrowing of the budget deficit over the past 18 months.
Taking a longer-run view
It is also useful to consider these developments in the long-run context of US fiscal policy.
For most of the past 60 years, government spending has exceeded revenues, with budget deficits the norm. However, several other trends and developments are worth noting.
First, two different tax and spending “regimes” are evident over the past four decades.
From 1983 until 2001, the US gradually implemented policies of spending restraint, at least relative to the growth rate of the economy. As a result, US government spending as a share of national income gradually declined, from 22.9% of GDP (1983) to 17.7% (2001).
In the second regime—from 2000 to 2020—the United States shifted to a lower-tax regime. Over those two decades, US government tax revenues (as a share of national income) steadily declined from 20.0% (2000) to 16.2% (2020).
In the first episode—and especially during the 1990s—falling government spending and rising government tax revenues (after 1993) resulted in a significant decline and then elimination of the federal government budget deficit. From 2000 to the eve of the pandemic, in contrast, increases in government spending coincided with falling government tax revenues to produce chronic budget deficits.
In short, since the early 1980s, the US government first pursued policies of fiscal rectitude, but since 2000 has amassed chronic deficits due to both trend increases in expenditures and decreases in government tax revenues, as a share of national income.
Growth and deficit reduction are compatible
Those trends are noteworthy for several reasons. First, it is possible to sustain strong economic growth while implementing fiscal consolidation. In the first subperiod (1983-2001), the US economy grew rapidly, particularly from 1995-2001. Rapid growth accommodated fiscal consolidation, with both spending restraint (from 1983 onwards) and rising tax revenues (from 1993 onwards) contributing to deficit reduction.
That point is worth emphasizing. Capping or reversing the accumulation of government debt need not come at the sacrifice of growth and rising living standards.
But as the second subperiod also demonstrates, growth alone will not necessarily lead to deficit and debt reduction. During the first two decades of this century, even periods of reasonable growth and exceptionally low unemployment did not deliver the same fiscal benefits as seen in the final decades of the last century.
Costly wars were one reason, as were steady increases in government spending on age-related benefits, including healthcare. But relative to the 1990s experience, the big difference was the tendency for government tax revenues to fall as a percentage of GDP. Big tax cuts in 2001 and again in 2017 contributed to that outcome. In that regard it is also crucial to highlight that sizable reductions in personal and corporate income tax rates did not increase overall government tax revenues.
Where do we spend, and how do we pay for it?
Finally, in the context of the political wrangling over fiscal policy, it may be worth displaying figures on what the federal government spends on and whom it taxes.
On the revenue side, the bulk of US federal government tax receipts come from individual income and payroll taxes. In 2022, for example, 84% of federal government tax revenues came via personal income tax and payroll tax collectively. In contrast, corporate income taxes accounted for 8.7% of total federal government revenues.
From a spending perspective, only 28% of total US federal government outlays is discretionary whereas 72% is mandatory.4 Discretionary spending is money that Congress must annually authorize, and the president then signs into law. Discretionary items include defense, health, education, agricultural and international affairs spending. Mandatory programs, on the other hand, are required by existing law and occur automatically without annual legislative authorization. Examples of mandatory spending include Social Security, Medicare, Medicaid and interest on the national debt.
Exhibit 2: Mandatory spending as a percentage of GDP spiked during the pandemic. The US Congressional Budget Office expects the mandatory spending and net interest as a percentage of GDP to gradually increase over the next decade. (right click to enlarge)
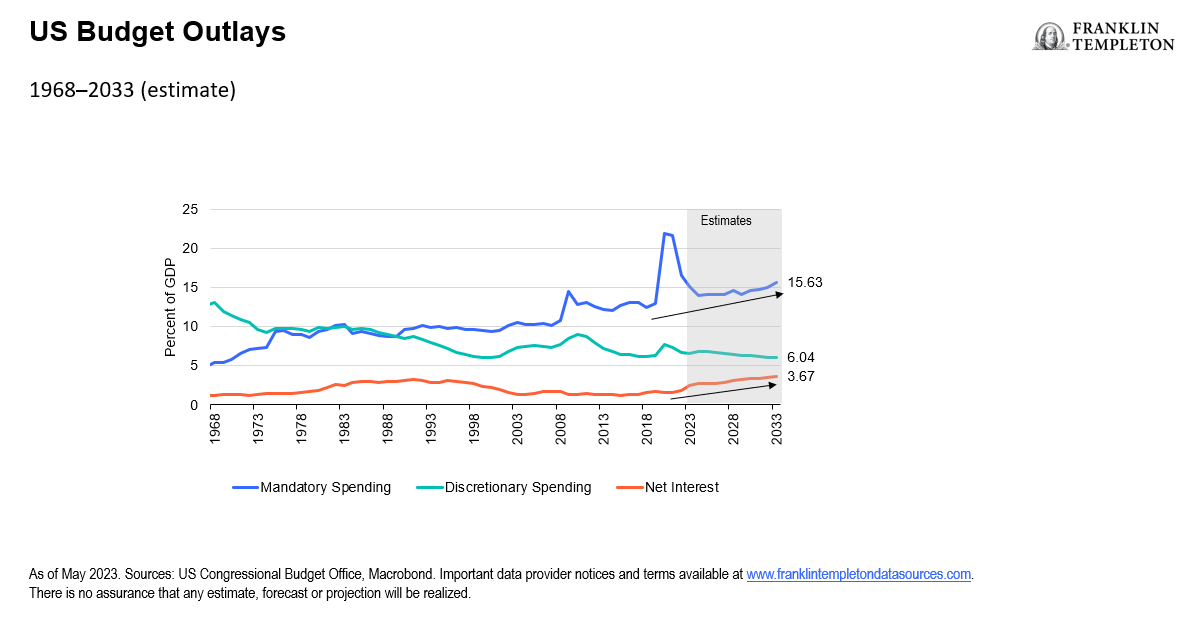
While theoretically all spending can be subject to negotiation, annual appropriations are decided for discretionary programs only (i.e., for just over a quarter of all outlays). Within discretionary spending (US$1.6 trillion dollars in 2021), the biggest items are defense (approximately 40% of the total), healthcare, education and veterans’ benefits. At the other end of the scale, accounting for 3% or less of total government expenditures, are items such as science, international affairs or energy policies.
The impact of interest payments
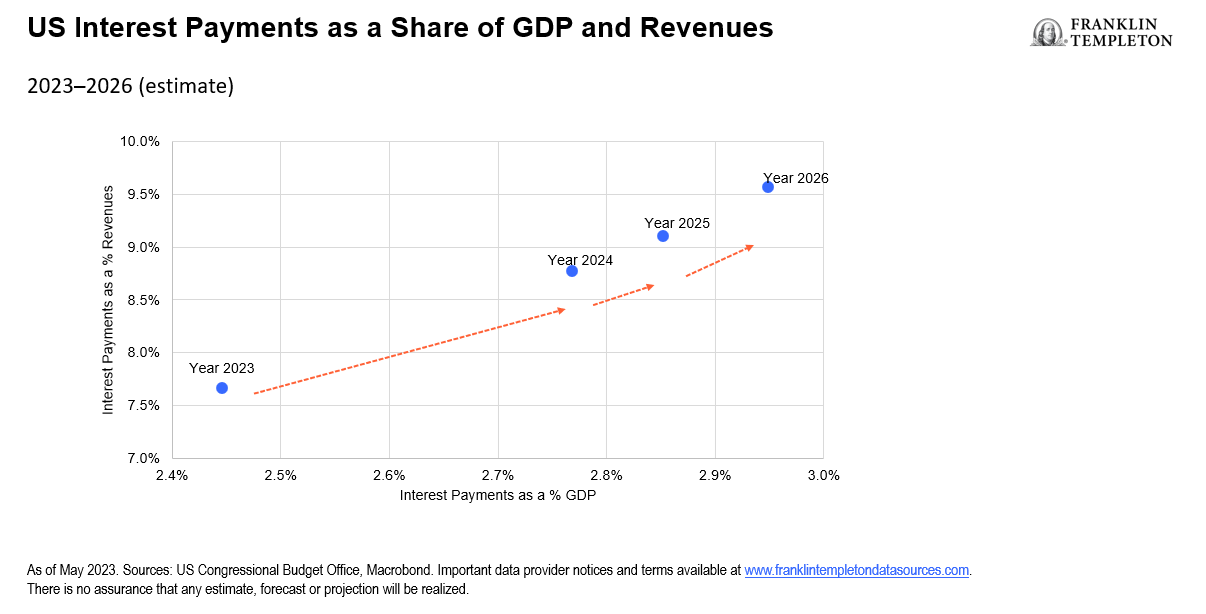
Over most of the past 15 years, very low interest rates kept the amount of interest paid to service the stock of national debt in check. Just prior to the pandemic, for instance, annual gross federal government outlays to pay interest on the national debt were about US$500 billion. Just three years later, courtesy of much higher indebtedness and rising interest rates, that figure has nearly doubled to US$930 billion.5 According to US Treasury estimates, the cost of servicing US federal government debt accounts for 13% of total federal government outlays in 2023.6
Rising interest payments pose budgetary challenges. All else equal, they reduce the capacity for spending in other areas.
Exhibits 3 and 4: Higher interest payments ahead (right click to enlarge)
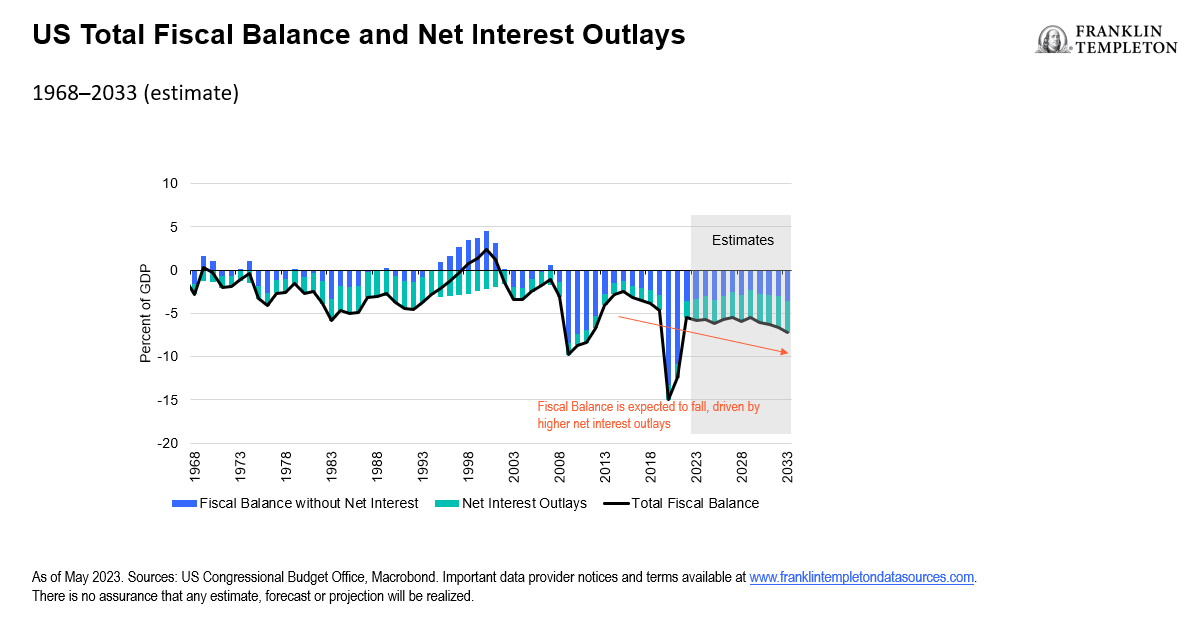
At the same time, it is worth noting that interest expense is also a source of revenue to many Americans—directly and indirectly via retirement savings programs. One of the net beneficiaries, for example, is social security, which invests excess revenues (via payroll taxes) over current expenditures in US Treasury notes and bonds.
Conclusions
Five broad conclusions emerge from our analysis.
First, the rapid increase in US indebtedness since 2000 owes much to the advent of two major economic shocks—the GFC and the pandemic. Without those calamities, government debt would be much smaller (perhaps by as much as a fifth smaller) and debate over US fiscal policy might not be quite so heated.
Second, higher interest expense on US government debt accounts for a growing share of government spending. Over time, interest expense will likely constrain government spending and/or require an increase in government tax revenues.
Third, the sources of rising government indebtedness in this century reflect a combination of increases in government spending and decreases in government tax revenues. That stands in marked contrast to the nearly two decades of gradual fiscal consolidation from the early 1980s until 2001. That development points to the fundamental political challenge about how to finance the spending that Americans seem to need or want.
Fourth, long-term fiscal consolidation is not at odds with sustained strong growth and high employment. Indeed, strong growth is almost certainly an economic and political precondition for deficit and debt reduction.
Fifth, given that sustained fiscal consolidation is best achieved alongside sustained strong growth, the question arises about how to achieve the latter. That question is all the more pressing given the receding tailwinds of globalization and the tepid productivity growth (despite rapid innovation). The challenges of tackling indebtedness almost certainly will require renewed efforts to boost productivity.
WHAT ARE THE RISKS?
All investments involve risks, including possible loss of principal. The value of investments can go down as well as up, and investors may not get back the full amount invested. Stock prices fluctuate, sometimes rapidly and dramatically, due to factors affecting individual companies, particular industries or sectors, or general market conditions. Bond prices generally move in the opposite direction of interest rates. Thus, as prices of bonds in an investment portfolio adjust to a rise in interest rates, the value of the portfolio may decline.
IMPORTANT LEGAL INFORMATION
This material is intended to be of general interest only and should not be construed as individual investment advice or a recommendation or solicitation to buy, sell or hold any security or to adopt any investment strategy. It does not constitute legal or tax advice. This material may not be reproduced, distributed or published without prior written permission from Franklin Templeton.
The views expressed are those of the investment manager and the comments, opinions and analyses are rendered as at publication date and may change without notice. The underlying assumptions and these views are subject to change based on market and other conditions and may differ from other portfolio managers or of the firm as a whole. The information provided in this material is not intended as a complete analysis of every material fact regarding any country, region or market. There is no assurance that any prediction, projection or forecast on the economy, stock market, bond market or the economic trends of the markets will be realized. The value of investments and the income from them can go down as well as up and you may not get back the full amount that you invested. Past performance is not necessarily indicative nor a guarantee of future performance. All investments involve risks, including possible loss of principal.
Any research and analysis contained in this material has been procured by Franklin Templeton for its own purposes and may be acted upon in that connection and, as such, is provided to you incidentally. Data from third party sources may have been used in the preparation of this material and Franklin Templeton (“FT”) has not independently verified, validated or audited such data. Although information has been obtained from sources that Franklin Templeton believes to be reliable, no guarantee can be given as to its accuracy and such information may be incomplete or condensed and may be subject to change at any time without notice. The mention of any individual securities should neither constitute nor be construed as a recommendation to purchase, hold or sell any securities, and the information provided regarding such individual securities (if any) is not a sufficient basis upon which to make an investment decision. FT accepts no liability whatsoever for any loss arising from use of this information and reliance upon the comments, opinions and analyses in the material is at the sole discretion of the user.
Products, services and information may not be available in all jurisdictions and are offered outside the U.S. by other FT affiliates and/or their distributors as local laws and regulation permits. Please consult your own financial professional or Franklin Templeton institutional contact for further information on availability of products and services in your jurisdiction.
Issued in the U.S. by Franklin Distributors, LLC, One Franklin Parkway, San Mateo, California 94403-1906, (800) DIAL BEN/342-5236, franklintempleton.com – Franklin Distributors, LLC, member FINRA/SIPC, is the principal distributor of Franklin Templeton U.S. registered products, which are not FDIC insured; may lose value; and are not bank guaranteed and are available only in jurisdictions where an offer or solicitation of such products is permitted under applicable laws and regulation.
CFA® and Chartered Financial Analyst® are trademarks owned by CFA Institute.
____________________
1. Source: Federal Reserve Bank of St. Louis, Office of Management and Budget.
2. Total government debt rose by $22.3 trillion from a total of $9.1 trillion in 2007 to $31.4 trillion in 2022. From 2008-2013 (GFC) and from 2020-2021 (pandemic), the cumulative size of US budget deficits was $14 trillion, or 63% of the total increase in indebtedness since 2007.
3. For example, total government debt as a percentage of GDP would be 93% today if half of the recorded budget deficits following the GFC and the pandemic had never materialized.
4. Source: Peter G. Peterson Foundation.
5. Sources: Federal Reserve Bank of St. Louis, Bureau of Economic Analysis.
6. Source: US Treasury.