

Watch the team’s discussion in the video below.
Executive summary
A decline in commercial real estate (CRE) prices is causing some investors to worry about the potential impact on their municipal (muni) bond holdings. In this publication, we dig deeper into the issue, and share some of the factors the Franklin Templeton Fixed Income (FTFI) muni credit research team considers in our security selection process. To answer the most pressing question first: We do not currently expect declining CRE valuations will lead to a wave of defaults among muni issuers, and we still believe in the sector’s fundamental strength. In our view, balance sheets currently look strong. Federal COVID-19 aid gave rainy-day funds a significant boost. Budgets significantly expanded through strong revenue increases during the post-pandemic recovery and have been maintained with conservative budgeting and fiscal discipline.
In our view, falling CRE values will not escalate into a sector-wide crisis. While we anticipate some ratings downgrades over the near to medium term, we believe they will be idiosyncratic in nature. In determining the overall impact decreased CRE valuations will likely have on specific muni issuers, our dedicated credit research team looks at a wide range of factors on a case-by-case basis.
First, revenue sources, tax bases and primary service areas differ significantly across issuer types (cities, counties, school districts, hospitals, etc.), which leads some issuers to be more sensitive than others to changes in property prices. Second, property valuation changes do not have an immediate revenue impact, but rather, trickle through into tax collections with a lag, allowing time for issuers to react and offering them a wide array of options to address declines. Fundamentally, municipalities can reshuffle expenditures in their budgets, raise revenues or tap reserves if needed to incorporate lower property tax receipts. Additionally, they can change policies to encourage development or other activities that result in more revenue to the city. Lastly, muni bonds often have additional protections, such as insurance, oversight programs and legal provisions, which can help mitigate against potential default events.
Despite the headwind CRE valuations pose on issuers, we continue to believe that attractive opportunities can be found regionally and nationally across the credit spectrum. Robust, bottom-up research and strong security selection will remain crucial in our view going forward. 
What is happening?
The post-pandemic reality of remote work has had wide-reaching implications—the most extreme of which has been termed in recent headlines as the “doom loop.” This “doom loop” refers to the fear that workers—having gotten used to the flexible working patterns established during the COVID-19 pandemic—will not return to the office. The fear is that this, in turn, could lead to a population flight out of cities. As a result, office space will become less valuable, leading to lower property tax revenue. And less foot traffic in the inner city would lead to decreased consumer spending that could cause businesses to close, impacting tax receipts. This could all lead to a potential increase in crime, leading even more people to leave the city. This clearly does sound disheartening. However, we continue to monitor situations like these across the country, and at this time, we are not concerned about the impact on our muni bond portfolios.
We wanted to share some insights into the various ways that the downturn in the CRE sector may impact credit fundamentals for local municipalities and issuers. As we dug deeper into the various muni issuers that CRE issues could affect, it was clear to us that this is a challenge that could have repercussions on local economies, revenues, employment, and perhaps even populations. However, we believe the term “doom loop” overstates the scale of the problem and oversimplifies its root causes. Additionally, there is a lagging impact on city and county revenues due to the timing of valuation assessments and underlying lease factors, as well as potential changes in return to office (RTO) requirements. In fact, lower revenues are only one component in this equation that proactive decision-making on the part of local and state governments can offset. Policymakers have a myriad of tools they can use to address these issues, which issuers from stressed locations are already demonstrating.
There is significant diversification across municipalities and the securities they issue
From an investor perspective, multiple factors lead us to remain optimistic about the outlook for muni bonds. First, diversification and strong security selection have always been a key factor in portfolio makeup and will remain important going forward. We continue to see many interesting credits nationally, as the extent of the CRE problem varies greatly across regions. Second, many of the bonds we buy have robust security provisions.
General obligation (GO) bonds, for example, are often backed by the unlimited taxing power of the issuing government, which includes levying additional taxes without limit to meet debt service payments. Furthermore, defaults among muni issuers are very rare. In fact, they are much lower than seen in investment-grade corporate bonds, with which the asset class is often compared.1 We do not foresee this materially changing going forward.
Our belief is that it’s difficult, if not impossible, to make generalizations. It is therefore important to thoroughly research and understand the underlying credit positions of issuers, with all the potential benefits and risks they carry. For example, the tax base on which municipalities depend will vary greatly from one muni bond to the next. Even among larger cities, which one could expect to be fairly homogenous, there are large differences in their business district concentration, the mix of commercial and residential exposure, and their dependence on property tax revenues. A good example of this is the city of San Francisco, which has caused many investors to worry. On one hand, the city is seeing a sluggish RTO trend and low downtown utilization; however, a wealthy tax base and low unemployment supports revenues.
Exhibit 1: Revenue Sources for Select US Cities (right click on chart to enlarge)
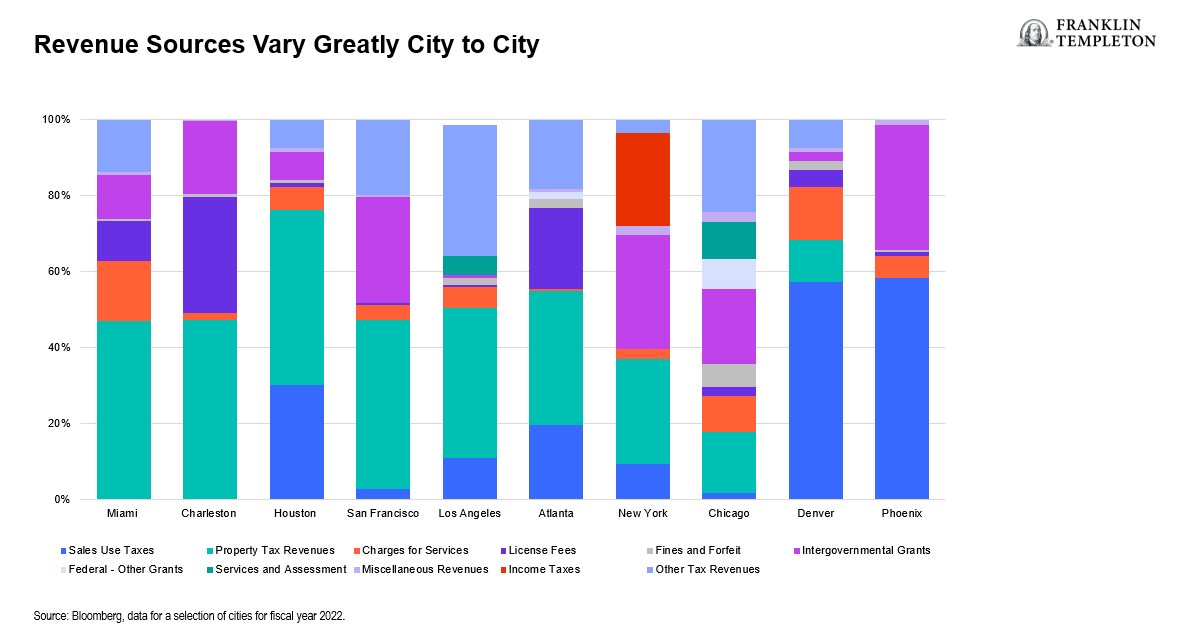
The above chart illustrates the variety of revenue sources across large US cities. As you can see, property taxes only make up a fraction of total revenues; they account for between 11.21% (for Denver) and 52.70% (for Miami) of total annual revenue collections. Going a step further, property taxes come from both residential and commercial real estate. Denver, for example, relies slightly more on commercial over residential, as the former accounts for 47% of its total property tax levy.
In contrast, San Francisco has a predominantly residential tax base, which makes up 68% of annual collections.2
The secondary effects of remote work and less-enticing downtown areas on sales tax receipts are also concerning. With fewer people returning to the office, spending in downtown restaurants and shops will drop, so sales tax collections by local governments will decline. However, in our assessment, some mitigating factors exist. The first is—interestingly enough—inflation. Some muni issuers benefit from tax collections on higher-priced goods and increased incomes, offering some relief from rising cost pressures. There are also some cities that are seeing localized spending in areas just outside the downtown core, as people shop and eat closer to where they live instead of where they work. There is also a switch from brick-and-mortar businesses to online channels, as “e-tail” sales taxes are based on the final shipping address.
Overall, the data indicate increased sales tax revenues so far this year. Even places like New York City, which has seen outmigration, recorded an increase of 11.30% year-over-year (y/y) in local sales tax collections for the first three months of 2023.3 Other examples include Houston and Dallas, where year-to-date sales and use tax collections are up 7.63% and 6.38% y/y, respectively.4
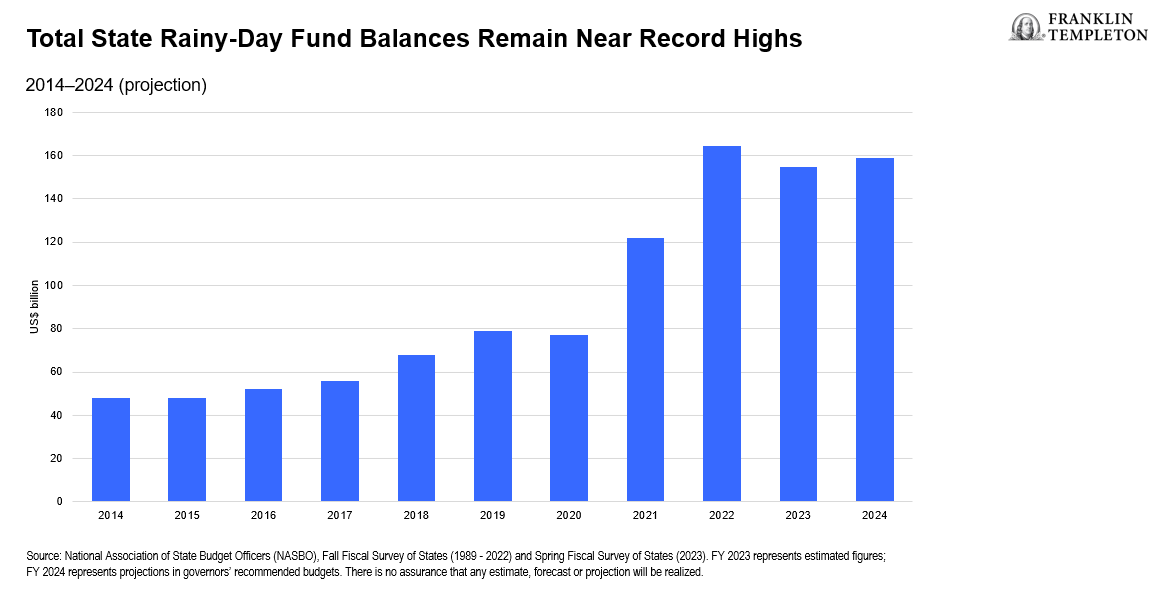
At the same time, overall credit fundamentals remain solid, and we believe that many issuers can withstand some challenges without facing significant ratings action. Year-to-date, rating upgrades have continued to outpace downgrades in the muni market, with rating agencies citing healthy debt service coverage ratios, robust cash reserves and improved liquidity levels as rationale for their ratings upgrades. Economic resilience is supported by historically high levels of rainy-day funds that were built up during the post-pandemic recovery and helped by federal COVID aid. Nationally, state rainy-day fund balances more than doubled between fiscal year (FY) 2019, i.e., before the pandemic, and FY 2024.
Exhibit 2: State Rainy-Day Fund Balances (right click on chart to enlarge)
Municipalities will feel the effects of declining CRE prices with a lag
Flexible RTO policies have resulted in increased office vacancy rates, and even those buildings that are leased are often empty. This has—and will likely continue to—put downward pressure on the market value of CRE, which, in turn, decreases property tax collections for local governments. However, leases are often signed for a term of multiple years, which means that downsizing takes time for a company, and property taxes are based on assessed values, which are often below current market prices.5
California is an interesting example, especially since San Francisco is often cited as having one of the most acute problems regarding the CRE slowdown. Yet, as mentioned above, San Francisco has a predominantly residential property tax base. Furthermore, California’s Proposition 13 caps the growth of the assessed value of all real estate (residential and commercial) at 2% a year, unless a sale or other assessable event such as new construction prompts a reassessment. Consequently, assessed values of many properties have yet to catch up to current market valuations, and therefore, property tax collections will not decline immediately. Revenues will only feel the impact with a substantial lag.
A New York City Comptroller study demonstrated the lag that declining property prices have on a municipality’s revenues. The Comptroller recently calculated multiple possible projections for the city’s tax levy over the coming years (based on the market values of Manhattan office space).6 In what the Comptroller’s office called the “doomsday” scenario, prices of Manhattan offices were projected to decline by 6% per year (spreading a 40% drop in value over the years 2023-2029). Even such drastic conditions showed a total property tax levy that deviated from the current baseline scenario by between -0.9% for FY 2025 and -3.0% for FY 2027. The latter led to an estimated shortfall of 1.0% of the city’s total revenues. While not insignificant, the bottom line is that this is not an insurmountable gap in the budget and therefore should not cause undue worry, in our view, especially since the local government can make up lost revenues elsewhere.
Municipalities have many tools (and some time) to react
Due to the lagged effects of declining CRE values on property tax revenues, municipalities have time to respond to declining receipts; fortunately, they have many tools at their disposal to do so. Perhaps the most straightforward is that other taxes and fees can be increased to make up for falling collections. Many municipalities have a balanced budget requirement, which means that if revenues decline, cost savings will need to be found elsewhere in order to avoid a deficit. Local and state governments also have the latitude to change existing policies, including the ability to loosen permit regulations for redevelopment in order to encourage developers to renovate and repurpose empty office space.
Conclusion
Overall, while we acknowledge that declining CRE valuations pose a headwind for some municipalities, we believe that the term “doom-loop” is not appropriate. From an investor’s perspective, there are certainly still many credits available nationally from which to choose, as there is significant dispersion between regions. This problem is far from universal and, accordingly, we are not worried about our muni bond portfolios at this time.
Moreover, even for those cities and counties that are hard-hit by remote work and high vacancy rates among offices, we do not project dire straits. The diversification of revenues and the lag with which falling real estate prices will trickle through into tax levies mean that local governments have plenty of time to react to the evolving situation, and they have ample tools to do so in our view.
In the meantime, credit fundamentals in the muni sector remain robust, in our view, and municipalities have large rainy-day funds which could help bridge any potential budget deficits over the short- to medium-term.
In these evolving times, it remains important to know the credits well, understanding their idiosyncrasies, dependencies, and protections. Thorough, bottom-up research is important to be able to find bonds from issuers that have solid underlying fundamentals and can weather a period of challenging macroeconomic conditions. This should also be supported by putting risk management at the forefront of portfolio construction to help prepare for a wide range of eventualities.
WHAT ARE THE RISKS?
All investments involve risks, including possible loss of principal.
Fixed income securities involve interest rate, credit, inflation and reinvestment risks, and possible loss of principal. As interest rates rise, the value of fixed income securities falls. Low-rated, high-yield bonds are subject to greater price volatility, illiquidity and possibility of default.
Changes in the credit rating of a bond, or in the credit rating or financial strength of a bond’s issuer, insurer or guarantor, may affect the bond’s value.
Active management does not ensure gains or protect against market declines.
IMPORTANT LEGAL INFORMATION
This material is intended to be of general interest only and should not be construed as individual investment advice or a recommendation or solicitation to buy, sell or hold any security or to adopt any investment strategy. It does not constitute legal or tax advice.
The views expressed are those of the investment manager and the comments, opinions and analyses are rendered as at publication date and may change without notice. The information provided in this material is not intended as a complete analysis of every material fact regarding any country, region or market. All investments involve risks, including possible loss of principal.
Data from third party sources may have been used in the preparation of this material and Franklin Templeton (“FT”) has not independently verified, validated or audited such data. FT accepts no liability whatsoever for any loss arising from use of this information and reliance upon the comments opinions and analyses in the material is at the sole discretion of the user.
Products, services and information may not be available in all jurisdictions and are offered outside the U.S. by other FT affiliates and/or their distributors as local laws and regulation permits. Please consult your own financial professional or Franklin Templeton institutional contact for further information on availability of products and services in your jurisdiction.
Issued in the U.S. by Franklin Templeton Distributors, Inc., One Franklin Parkway, San Mateo, California 94403-1906, (800) DIAL BEN/342-5236, franklintempleton.com—Franklin Templeton Distributors, Inc. is the principal distributor of Franklin Templeton U.S. registered products, which are not FDIC insured; may lose value; and are not bank guaranteed and are available only in jurisdictions where an offer or solicitation of such products is permitted under applicable laws and regulation.
CFA® and Chartered Financial Analyst® are trademarks owned by CFA Institute.
_____________________
1. Source: J.P. Morgan, Municipal Markets Weekly, for FY 2022.
2. Source: New York State Department of Taxation and Finance, with calculations by the Office of the New York State Comptroller.
3. Source: Texas Open Data Portal, as of July 12, 2023.
4. Moody’s Investors Services (1970-2022 study).
5. Source: Investortools Credit Scope.
6. Source: New York City Comptroller Brad Lander. Spotlight: What Risks Does the Office Market Pose for the City’s Finances? Bureau of Budget, June 2023. Market valuations were based on the net operating income (NOI) in the prior fiscal year, while, as stated above, assessed value changes were phased in gradually.