Key takeaways
- While the macro backdrop has improved, we believe risky assets are priced too optimistically. At a portfolio level, we remain slightly defensive.
- However, some risky assets have lagged the broader market rally and appear attractive, specifically, US small capitalization stocks (small caps) and emerging market (EM) equities.
- We explore some rationale for the performance lag in these two areas. Ultimately, we believe much of the bad news is priced-in, and catalysts are on the near horizon. We think these two assets offer positive asymmetry and are a smart place to add risk in multi-asset portfolios.
Are investors too optimistic?
In some regions, including the United States, the macro backdrop has been improving. Growth remains resilient, with strong service sector activity and a stabilizing manufacturing environment. Inflation continues to abate, with inflation surprises near three-year lows. Federal Reserve (Fed) policy is restrictive, but the odds of “peak Fed” rates have grown substantially over recent months. Overall, the probability of a soft landing has certainly risen.
How are asset prices reacting to this news? Risky assets—such as equities and high-yield credit—did not wait for the “all clear” sign from macro-land. Their rally began nearly a year ago in October 2022 at the first signs of a peak in inflation, but well before a substantial improvement in growth or monetary policy. Most equity markets have achieved bull market status, while corporate bond spreads are near cyclical tights.
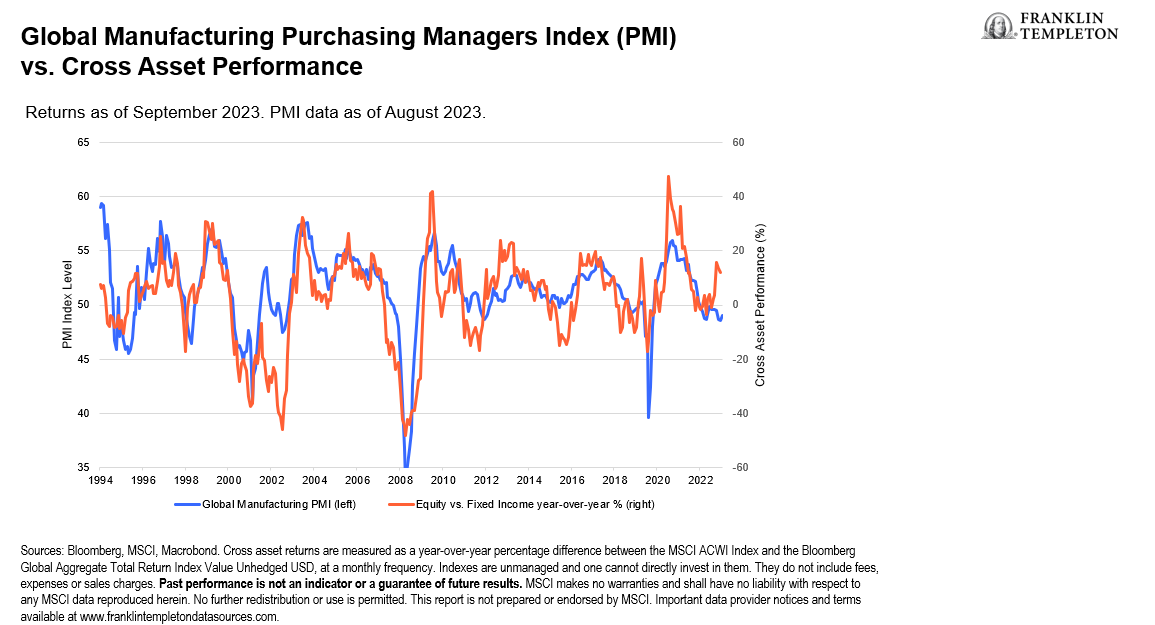
The challenge today is that most risky assets have rallied ahead of both the current and projected macro environment (see Exhibit 1). In our view, most risky assets are pricing in macro expectations that are overly optimistic. While the macro backdrop has improved, we still believe there is considerable uncertainty over what lies ahead next year.
Exhibit 1: Risky assets are overly optimistic (right click on chart to enlarge)

The mispricing of risky assets is a key reason why we remain slightly defensive at the portfolio level. We favor fixed income over equities, where it is now relatively easy to find high-quality bonds yielding over 5% with little duration or credit risk.
Where to add risk in multi-asset portfolios
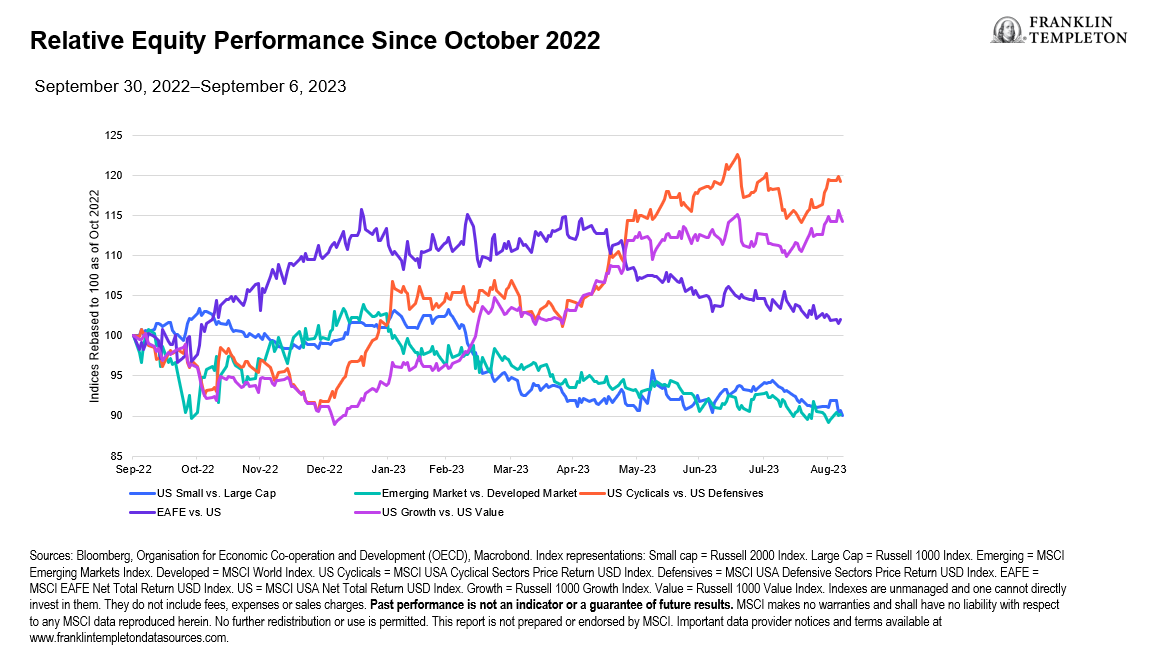
While most global equity markets have rallied since last October, not every index has performed equally. We examine equity pairings that historically perform well when growth is beginning to improve from below-trend levels, which is the environment many regions are in today (see Exhibit 2). While some parts of the equity market have performed well—cyclicals and growth stocks—other parts have lagged considerably, namely US small caps and emerging markets.
Exhibit 2: What Has Outperformed During the Most Recent Equity Rally? (right click on chart to enlarge)

It is not hard to rationalize why these equity markets have lagged.
US small cap stocks are generally more sensitive to higher interest rates, due to a larger amount of variable rate debt and weaker balance sheets (i.e., lower interest coverage ratios). Plus, exposure to the artificial intelligence (AI) theme and the “magnificent 7” group of technology stocks is much more limited within small caps. In emerging markets, China’s economy continues to struggle for momentum, and more broadly, we have observed a weak global manufacturing environment.
The good news is that these risks appear to be largely priced in. Valuation ratios, like price-to-earnings or price-to-book, suggest these assets are attractively valued. However, valuations are not good tactical indicators. Therefore, we identify some key catalysts that are developing in support of US small caps and emerging market equities that we believe markets have yet to fully reflect.
US small caps
- US interest rates are unlikely to move much higher from here. Historically, rate increases have had a lagged effect, with Treasury yields lower a year following the end of the Fed’s rate-hike cycle. Typically, performance for small cap stocks one year following the Fed’s final rate hike in the cycle has been robust.
- Small-cap stock performance has historically benefited from falling inflation.
- Small caps tend to outperform when leading indicators recover from below-trend, which our team believes is currently taking place.
Emerging markets
- Some measures of relative growth, like manufacturing PMIs, suggest stronger growth for EMs over developed markets (DMs).
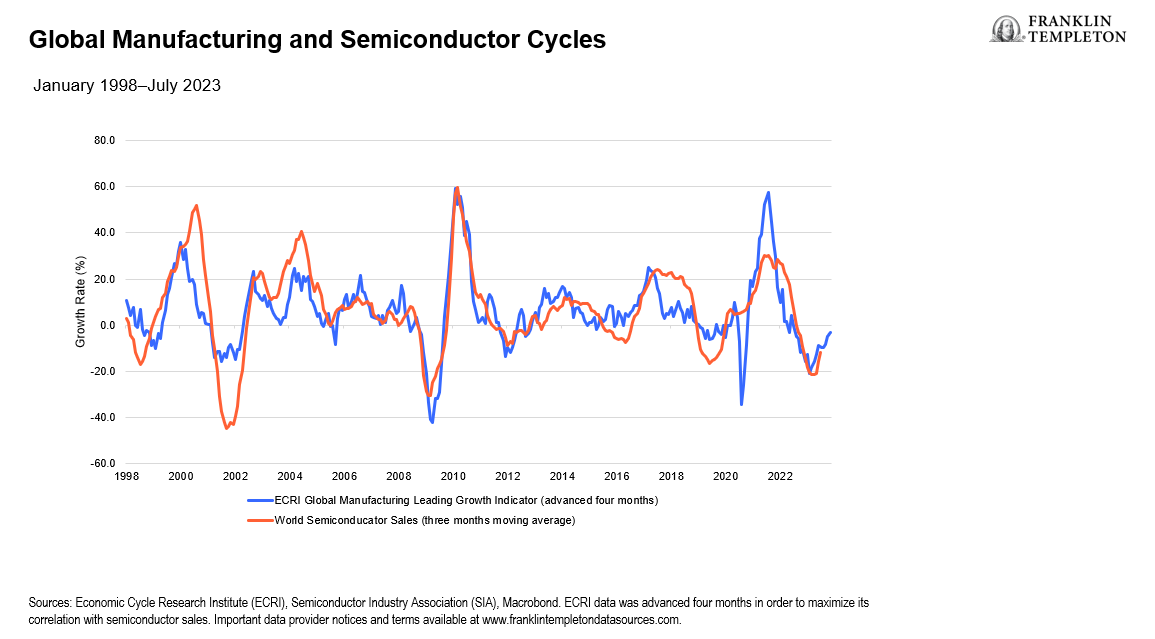
- Some leading indicators of global manufacturing are also rebounding. Along with rising AI demand, this trend should bode well for semiconductors (see Exhibit 3), a key export for EM Asia (Taiwan and South Korea). According to World Trade Semiconductor Statistics, global semiconductor sales are forecast to grow by 11.8% in 2024.1
- China’s policy environment is showing signs of proactiveness. In September alone, more than 30 provinces and cities have enhanced property policies to support growth.
- Disinflation is prevalent across many EM countries after strong rate hiking cycles. Over the next year, we expect policy easing to be more supportive compared to DM markets.
Exhibit 3: Leading Manufacturing Indicators Should Improve Semiconductor Sales (right click on chart to enlarge)

Putting it all together
We remain slightly defensive at the portfolio level due to the general expensiveness of risky assets, like equities and high yield credit, especially relative to many developed market government bonds. However, we have shown that not all equity markets seem expensive; US small caps and emerging markets have attractive valuations, in our view. Additionally, they are geared to an improving macro environment, have near-term catalysts, and can offer positive performance asymmetry over the next year. Overall, we think US small caps and emerging markets are smart places to add risk in multi-asset portfolios.
WHAT ARE THE RISKS?
All investments involve risks, including possible loss of principal.
Equity securities are subject to price fluctuation and possible loss of principal. Small- and mid-cap stocks involve greater risks and volatility than large-cap stocks.
Fixed income securities involve interest rate, credit, inflation and reinvestment risks, and possible loss of principal. As interest rates rise, the value of fixed income securities falls. Low-rated, high-yield bonds are subject to greater price volatility, illiquidity and possibility of default.
International investments are subject to special risks, including currency fluctuations and social, economic and political uncertainties, which could increase volatility. These risks are magnified in emerging markets.
The government’s participation in the economy is still high and, therefore, investments in China will be subject to larger regulatory risk levels compared to many other countries.
There are special risks associated with investments in China, Hong Kong and Taiwan, including less liquidity, expropriation, confiscatory taxation, international trade tensions, nationalization, and exchange control regulations and rapid inflation, all of which can negatively impact the fund. Investments in Taiwan could be adversely affected by its political and economic relationship with China.
Alternative strategies may be exposed to potentially significant fluctuations in value.
Active management does not ensure gains or protect against market declines.
IMPORTANT LEGAL INFORMATION
This material is intended to be of general interest only and should not be construed as individual investment advice or a recommendation or solicitation to buy, sell or hold any security or to adopt any investment strategy. It does not constitute legal or tax advice. This material may not be reproduced, distributed or published without prior written permission from Franklin Templeton.
The views expressed are those of the investment manager and the comments, opinions and analyses are rendered as at publication date and may change without notice. The underlying assumptions and these views are subject to change based on market and other conditions and may differ from other portfolio managers or of the firm as a whole. The information provided in this material is not intended as a complete analysis of every material fact regarding any country, region or market. There is no assurance that any prediction, projection or forecast on the economy, stock market, bond market or the economic trends of the markets will be realized. The value of investments and the income from them can go down as well as up and you may not get back the full amount that you invested. Past performance is not necessarily indicative nor a guarantee of future performance. All investments involve risks, including possible loss of principal.
Any research and analysis contained in this material has been procured by Franklin Templeton for its own purposes and may be acted upon in that connection and, as such, is provided to you incidentally. Data from third party sources may have been used in the preparation of this material and Franklin Templeton (“FT”) has not independently verified, validated or audited such data. Although information has been obtained from sources that Franklin Templeton believes to be reliable, no guarantee can be given as to its accuracy and such information may be incomplete or condensed and may be subject to change at any time without notice. The mention of any individual securities should neither constitute nor be construed as a recommendation to purchase, hold or sell any securities, and the information provided regarding such individual securities (if any) is not a sufficient basis upon which to make an investment decision. FT accepts no liability whatsoever for any loss arising from use of this information and reliance upon the comments, opinions and analyses in the material is at the sole discretion of the user.
Products, services and information may not be available in all jurisdictions and are offered outside the U.S. by other FT affiliates and/or their distributors as local laws and regulation permits. Please consult your own financial professional or Franklin Templeton institutional contact for further information on availability of products and services in your jurisdiction.
Issued in the U.S. by Franklin Distributors, LLC, One Franklin Parkway, San Mateo, California 94403-1906, (800) DIAL BEN/342-5236, franklintempleton.com – Franklin Distributors, LLC, member FINRA/SIPC, is the principal distributor of Franklin Templeton U.S. registered products, which are not FDIC insured; may lose value; and are not bank guaranteed and are available only in jurisdictions where an offer or solicitation of such products is permitted under applicable laws and regulation.
CFA® and Chartered Financial Analyst® are trademarks owned by CFA Institute.
__________________________
1. There is no assurance any estimate, forecast or projection will be realized.

