

In the final weeks of 2023, stocks and bonds both rallied, and the rise in share prices of US small-capitalization companies—at long last—added to the holiday cheer. The small-cap Russell 2000 Index surged 12% in December (ending the year +15%) and outperformed larger caps (as measured by the S&P 500), which rose about 4.5% for the month.1 We believe the uptick may signal a turnaround for the small-cap space, following a rough decade during which smaller companies significantly trailed their large-cap peers by nearly 4% per year, on average.2
For much of last year, regional bank share prices slumped as investor sentiment for the segment soured due to the spring banking crisis and higher interest rates, and this disproportionately affected small caps. Given smaller companies’ relative reliance on shorter-term debt, they generally suffered from elevated borrowing costs more so than large caps did. Meanwhile, the rising artificial intelligence (AI) trend boosted tech giants, leading the S&P 500 to close out the year with a gain of more than 24%.
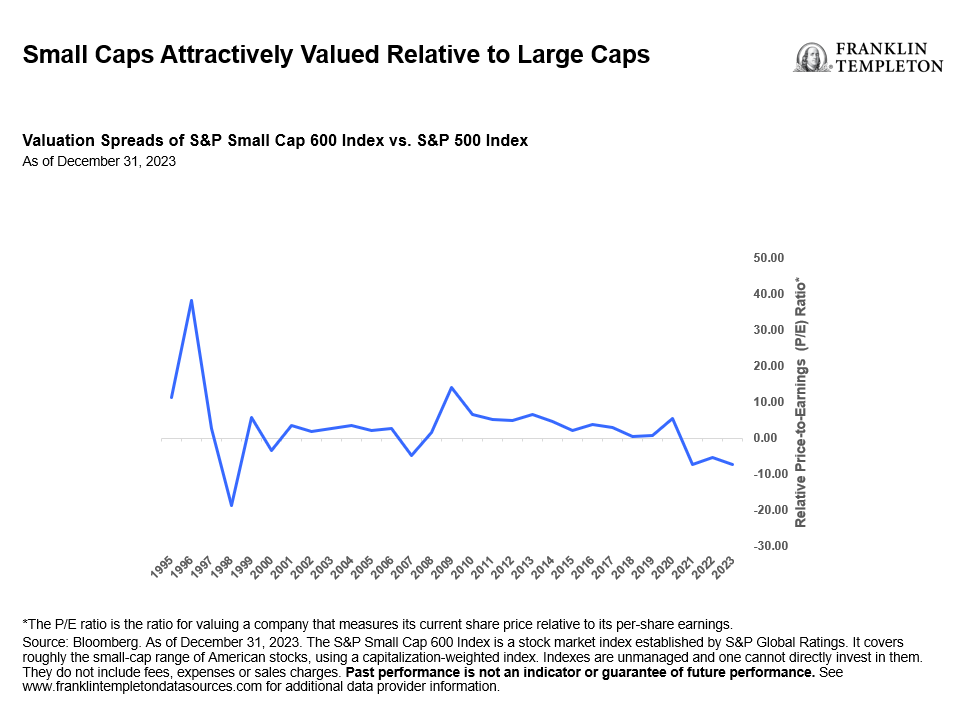
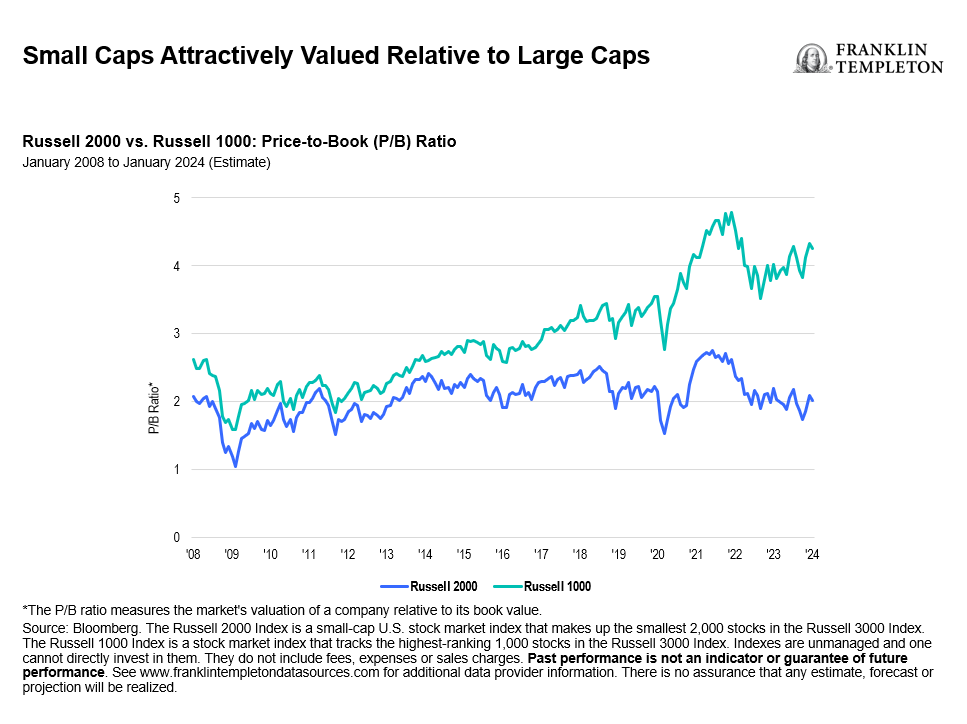
But the good news is that, in our analysis, small-cap valuations are now trading at an attractive discount to the S&P 500 and the Russell 1000. Prospects for a potential end to the rate-hike cycle, signs of cooling inflation and a robust labor market all provide tailwinds for small caps both in absolute and relative terms. Investors seeking to gain exposure to size-risk premium—the additional return expected by investing in small-cap stocks compared to large-cap stocks—can choose a higher allocation to funds focused on the small-cap segment. The small-cap stock premium (size effect) is one of the few effects that tends to find consensus support among researchers. The seminal academic findings of financial economists Eugene Fama and Kenneth French,3 based on decades of stock market history, showed that over time, companies with smaller market capitalizations had outperformed the overall market. The theoretical rationale that emerged was that of a size advantage, meaning smaller-cap companies—being more volatile or riskier—over longer periods also tended to better compensate investors for their additional risk. This is often also referred to as the size anomaly associated with factor investing.
While size-based strategies have been employed for decades since then, index provider MSCI notes in a paper on factor investing that only in recent years have transparent, rules-based indexes provided effective ways to expose portfolios to the size premium.4
Generally, the tendency for smaller companies to have longer runways for growth and greater flexibility during the business cycle can support the “size effect” premium.
If you’ve been seeking a diversification boost to remedy “Magnificent Seven”—Amazon, Alphabet, Apple, Microsoft, Meta, Tesla and Nvidia—overexposure, remember that the universe of small-cap companies covers a wider breadth of sectors and industries. Allocation to nimble, smaller companies with greater expansion opportunities than their larger counterparts could provide early access to future leading businesses.
Like US mid-cap indexes, small-cap indexes tend to be overweight in industrials. This is a sector that is arguably ramping up following government stimulus plans that include the US$1 trillion Infrastructure and Jobs Act (2021), clean energy spending related to the Inflation Reduction Act (2022), and the CHIPS and Science Act (2022), which is poised to strengthen American manufacturing, supply chains and a range of technologies.
Of course, there are inherent risks to investing in this asset class, such as the likelihood of encountering greater exposure to illiquid, lesser-known names with little to no analyst coverage. What’s more, some 40% of Russell 2000 Index companies have negative earnings.5
Investors seeking solutions that can offer a smoother, long-term experience may find multifactor exchange-traded strategies a better way of accessing solid risk-adjusted returns for small caps. Such approaches, like that of the LibertyQ US Small Cap Equity Index, screen for quality, value, momentum and low volatility to help weather the market volatility of the small-cap universe. For the 12 months ended December 31, 2023, value and quality were the main drivers of returns for the Index and its return on equity (ROE) was 4% higher than the Russell Small Cap Index.6
After years of underperformance, investors may find 2024 an opportune time to reassess their small-cap exposure.
WHAT ARE THE RISKS?
All investments involve risks, including possible loss of principal. Equity securities are subject to price fluctuation and possible loss of principal. Small- and mid-cap stocks involve greater risks and volatility than large-cap stocks. There can be no assurance that multi-factor stock selection process will enhance performance. Exposure to such investment factors may detract from performance in some market environments, perhaps for extended periods. Active management does not ensure gains or protect against market declines.
ETFs trade like stocks, fluctuate in market value and may trade above or below the ETF’s net asset value. Brokerage commissions and ETF expenses will reduce returns. ETF shares may be bought or sold throughout the day at their market price on the exchange on which they are listed. However, there can be no guarantee that an active trading market for ETF shares will be developed or maintained or that their listing will continue or remain unchanged. While the shares of ETFs are tradable on secondary markets, they may not readily trade in all market conditions and may trade at significant discounts in periods of market stress.
Commissions, management fees, brokerage fees and expenses may be associated with investments in ETFs. Please read the prospectus and ETF facts before investing. ETFs are not guaranteed, their values change frequently, and past performance may not be repeated.
Any companies and/or case studies referenced herein are used solely for illustrative purposes; any investment may or may not be currently held by any portfolio advised by Franklin Templeton. The information provided is not a recommendation or individual investment advice for any particular security, strategy, or investment product and is not an indication of the trading intent of any Franklin Templeton managed portfolio.
IMPORTANT LEGAL INFORMATION
This material is intended to be of general interest only and should not be construed as individual investment advice or a recommendation or solicitation to buy, sell or hold any security or to adopt any investment strategy. It does not constitute legal or tax advice. This material may not be reproduced, distributed or published without prior written permission from Franklin Templeton.
The views expressed are those of the investment manager and the comments, opinions and analyses are rendered as at publication date and may change without notice. The underlying assumptions and these views are subject to change based on market and other conditions and may differ from other portfolio managers or of the firm as a whole. The information provided in this material is not intended as a complete analysis of every material fact regarding any country, region or market. There is no assurance that any prediction, projection or forecast on the economy, stock market, bond market or the economic trends of the markets will be realized. The value of investments and the income from them can go down as well as up and you may not get back the full amount that you invested. Past performance is not necessarily indicative nor a guarantee of future performance. All investments involve risks, including possible loss of principal.
Any research and analysis contained in this material has been procured by Franklin Templeton for its own purposes and may be acted upon in that connection and, as such, is provided to you incidentally. Data from third party sources may have been used in the preparation of this material and Franklin Templeton (“FT”) has not independently verified, validated or audited such data. Although information has been obtained from sources that Franklin Templeton believes to be reliable, no guarantee can be given as to its accuracy and such information may be incomplete or condensed and may be subject to change at any time without notice. The mention of any individual securities should neither constitute nor be construed as a recommendation to purchase, hold or sell any securities, and the information provided regarding such individual securities (if any) is not a sufficient basis upon which to make an investment decision. FT accepts no liability whatsoever for any loss arising from use of this information and reliance upon the comments, opinions and analyses in the material is at the sole discretion of the user.
Products, services and information may not be available in all jurisdictions and are offered outside the U.S. by other FT affiliates and/or their distributors as local laws and regulation permits. Please consult your own financial professional or Franklin Templeton institutional contact for further information on availability of products and services in your jurisdiction.
Issued in the U.S. by Franklin Distributors, LLC, One Franklin Parkway, San Mateo, California 94403-1906, (800) DIAL BEN/342-5236, franklintempleton.com – Franklin Distributors, LLC, member FINRA/SIPC, is the principal distributor of Franklin Templeton U.S. registered products, which are not FDIC insured; may lose value; and are not bank guaranteed and are available only in jurisdictions where an offer or solicitation of such products is permitted under applicable laws and regulation.
CFA® and Chartered Financial Analyst® are trademarks owned by CFA Institute.
__________
1. Source: Bloomberg. The Russell 2000 Index is a small-cap U.S. stock market index that makes up the smallest 2,000 stocks in the Russell 3000 Index. Indexes are unmanaged and one cannot directly invest in them. They do not include fees, expenses or sales charges. Past performance is not an indicator or guarantee of future performance. See www.franklintempletondatasources.com for additional data provider information.
2. Ibid.
3. Fama, E. and French, K. “Common Risk Factors in the Returns on Stocks and Bonds.” Journal of Financial Economics. 1993.
4. Source: “Factor Investing—Factor Focus: Size.” MSCI. 2016.
5. Sources: Bloomberg, FactSet. As of December 2023.
6. Source: Morningstar. As of December 31, 2023. The LibertyQ US Small Cap Equity Index is based on the Russell 2000 Index, its parent index, which measures the performance of the small-cap segment of the US equity universe. The LibertyQ US Small Cap Equity Index is designed to reflect the performance of a Franklin Templeton strategy that seeks exposure to four factors: Quality, Value, Momentum and Low Volatility. Indexes are unmanaged and one cannot directly invest in them. They do not include fees, expenses or sales charges. Past performance is not an indicator or guarantee of future performance. See www.franklintempletondatasources.com for additional data provider information.