

For months, we’ve pushed back against the idea that the Federal Reserve (Fed) will begin its easing cycle as early as March. Indeed, that is precisely what Fed Chair Jerome Powell confirmed at the January Federal Open Market Committee (FOMC) meeting. Unsurprisingly, gone was any language that referenced “any additional tightening,” thus further cementing the December pivot.
Moreover, instead of pivoting directly toward an easing bias, the FOMC opted for a wait-and-watch, data-dependent approach. Powell explicitly stated that a March rate cut is not the base case, and that the Fed will need to have “gained greater confidence that inflation is moving sustainably towards 2%” before reducing the policy target range. I emphasize “sustainably” because several commentators (including Fed policymakers themselves) have pointed to sub-2% short-run inflation momentum measures—namely the three- and six-month annualized rates for core Personal Consumption Expenditures (PCE) to justify an earlier start to the rate-cutting cycle. However, “sustainable” implies continued progress toward the Fed’s 2% target beyond the immediate short run, too. And there’s still some ways to go in that regard, with potential for hiccups on the way.
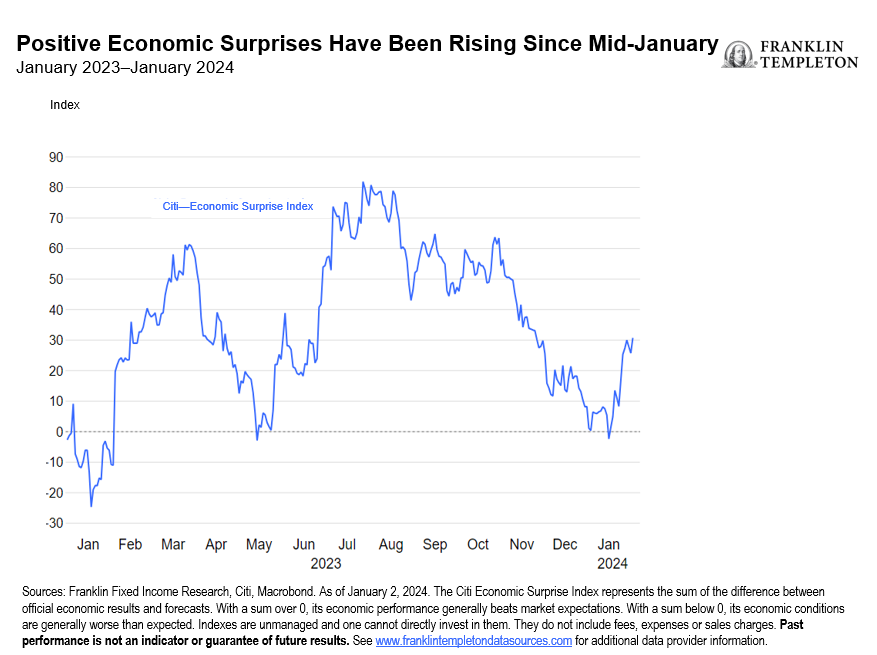
As far as the incoming economic data are concerned, there has been very little in it over the last few months to suggest the Fed should start cutting before the summer. If anything, a plethora of data has surprised to the upside since mid-January. Citi’s Economic Surprise Index shows an increase in positive data surprises over the said period.1
In fact, the January US labor-market report was one of biggest surprises, with monthly payrolls nearly double the Bloomberg consensus estimate and the December payrolls also seeing a significant upward revision (+117,000). The January report also showed that hiring was in fact much broader based than previously thought, and not concentrated primarily in acyclical sectors such as health care. While the headline participation rate was down, the prime-age cohort and the 20-24 age cohort saw an increase in participation—something the Fed would likely view positively. The unemployment rate remained unchanged at a historically low level of 3.7%.2 Meanwhile, labor reabsorption (flows from unemployed to employed) or matching efficiency remained at levels consistent with pre-pandemic levels.
More importantly, the acceleration in average hourly earnings (0.6% in January vs. 0.3% in December) is something I think would certainly unsettle the Fed. True, the Employment Cost Index (ECI) did slow in the fourth quarter of 2023, but neither the ECI nor average hourly earnings (AHE) are currently consistent with a 2% inflation target. On a six-month annualized basis, growth in ECI Wages and Salaries and AHE continue to remain well above their 2016-2019 averages. All in all, the January labor market report likely left the Fed feeling vindicated on its decision to wait and watch. The stronger data also meant that the probability of a rate cut for March has dropped to under 25% at the time of writing.
On inflation, the short-run measures of core PCE have indeed declined to sub-2%. However, the supercore measure (core services ex. housing)—a measure the Fed repeatedly referenced for the better part of 2023—grew 2.8% on a six-month annualized basis in December and remains above 3% on a year/year (y/y) basis.3 In my view, that alone warrants a wait-and-watch approach given the still-healthy labor market and rising household real incomes, as inflation slows.
The picture for shelter/rental inflation also remains hazy at best. PCE rent levels have yet to catch up to market levels. Zillow’s observed rents are up 27% since January 2021, while PCE tenant and owner-occupied rent levels are up 19%.4That is possibly one reason the month/month changes for PCE rents have oscillated between 0.4% and 0.5% since March last year, and not disinflated further. The decline in apartment rents (as per Apartment List) could lead to some disinflation in tenant occupied multifamily homes. Note that homebuilding and completions have also risen substantially in the multifamily category since the Fed started raising rates two years ago. However, the continued increase in house prices (Federal Housing Finance Agency: 6.6% y/y, Case Shiller: 5.2% y/y),5 may have a greater influence on the owner-occupied rental measures.
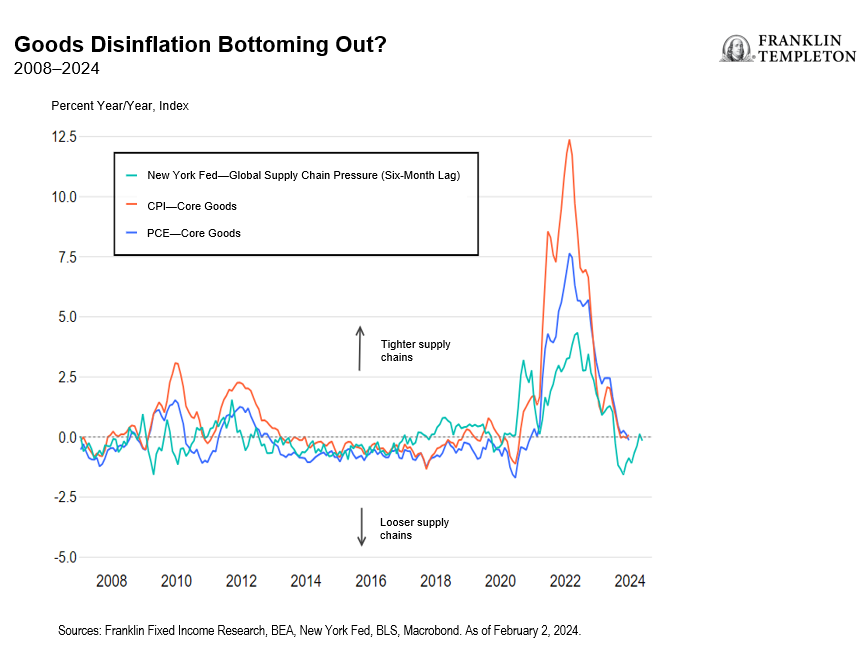
Goods disinflation, a source of comfort through 2023, could start to moderate this year as the Fed’s global supply-chain index has shown a continuous build up in supply-chain pressures since mid-2023. Disruptions to trade routes in the Red Sea have already led to a rise in freight rates (although the Asia-Europe route has been more severely affected for now). The longer these disruptions persist, the greater the chances the effects of the delays and rising costs will start to show up in goods prices.
On balance, given an economy that continues to grow well above potential, a still-healthy labor market and the possibility of inflation (and wage inflation) surprises going forward, the Fed’s data-dependent approach makes sense. That said, rate cuts are coming, but probably not as many or quite as soon as markets have been anticipating. Since monetary policy will turn tighter passively as inflation cools, rate cuts will be needed to avoid excessively high real rates.
While our base case is for a 75-basis point reduction this year in the fed funds rate, with the first cut coming this summer (June/July), that could change if the economy starts to deteriorate materially, or equally important (if not more), if the financial stability risks emerging from the US commercial real estate market snowball into something larger. In our view, an increase even in the perceived risk of a mishap could end up forcing the Fed to act sooner and more forcefully.
WHAT ARE THE RISKS?
All investments involve risks, including possible loss of principal.
Fixed income securities involve interest rate, credit, inflation and reinvestment risks, and possible loss of principal. As interest rates rise, the value of fixed income securities falls. Low-rated, high-yield bonds are subject to greater price volatility, illiquidity and possibility of default.
IMPORTANT LEGAL INFORMATION
This material is intended to be of general interest only and should not be construed as individual investment advice or a recommendation or solicitation to buy, sell or hold any security or to adopt any investment strategy. It does not constitute legal or tax advice. This material may not be reproduced, distributed or published without prior written permission from Franklin Templeton.
The views expressed are those of the investment manager and the comments, opinions and analyses are rendered as at publication date and may change without notice. The underlying assumptions and these views are subject to change based on market and other conditions and may differ from other portfolio managers or of the firm as a whole. The information provided in this material is not intended as a complete analysis of every material fact regarding any country, region or market. There is no assurance that any prediction, projection or forecast on the economy, stock market, bond market or the economic trends of the markets will be realized. The value of investments and the income from them can go down as well as up and you may not get back the full amount that you invested. Past performance is not necessarily indicative nor a guarantee of future performance. All investments involve risks, including possible loss of principal.
Any research and analysis contained in this material has been procured by Franklin Templeton for its own purposes and may be acted upon in that connection and, as such, is provided to you incidentally. Data from third party sources may have been used in the preparation of this material and Franklin Templeton (“FT”) has not independently verified, validated or audited such data. Although information has been obtained from sources that Franklin Templeton believes to be reliable, no guarantee can be given as to its accuracy and such information may be incomplete or condensed and may be subject to change at any time without notice. The mention of any individual securities should neither constitute nor be construed as a recommendation to purchase, hold or sell any securities, and the information provided regarding such individual securities (if any) is not a sufficient basis upon which to make an investment decision. FT accepts no liability whatsoever for any loss arising from use of this information and reliance upon the comments, opinions and analyses in the material is at the sole discretion of the user.
Products, services and information may not be available in all jurisdictions and are offered outside the U.S. by other FT affiliates and/or their distributors as local laws and regulation permits. Please consult your own financial professional or Franklin Templeton institutional contact for further information on availability of products and services in your jurisdiction.
Issued in the U.S.: Franklin Resources, Inc. and its subsidiaries offer investment management services through multiple investment advisers registered with the SEC. Franklin Distributors, LLC and Putnam Retail Management LP, members FINRA/SIPC, are Franklin Templeton broker/dealers, which provide registered representative services. Franklin Templeton, One Franklin Parkway, San Mateo, California 94403-1906, (800) DIAL BEN/342-5236, franklintempleton.com.
Please visit www.franklinresources.com to be directed to your local Franklin Templeton website.
____________
1. The Citigroup Economic Surprise Index represents the sum of the difference between official economic results and forecasts. Indexes are unmanaged and one cannot directly invest in them. They do not include fees, expenses or sales charges. Past performance is not an indicator or a guarantee of future results.
2. Source: Bureau of Labor Statistics. As of February 2, 2024.
3. Sources: Bloomberg and Bureau of Labor Statistics. As of February 2, 2024.
4. Source: Macrobond, Zillow and Bureau Economic Analysis. As of February 2, 2024.
5. Year over year through November 2023.