

Policymakers meet in Jackson Hole, Wyoming, August 24-26 to discuss “Structural Shifts in the Global Economy.” The current volatility in bond markets highlights just how important it is to get these structural shifts right—and not to mistake for structural something that is instead temporary and policy-driven.
I have long been arguing that the Federal Reserve (Fed) will have to keep interest rates higher for longer, and markets seem to be coming around to the idea. I also remain convinced that when the Fed eases policy, interest rates will not come down as much as most people think, for two reasons: First, because the equilibrium real interest rate is higher than what the Fed and a majority of analysts believe. Second, because loose fiscal policy will keep boosting bond supply.
R-star strikes back
Let’s start with the equilibrium real interest rate.
The Federal Open Market Committee’s (FOMC’s) forecasts still indicate a long-term nominal fed funds rate of 2.5%. Since in the long term, inflation is supposed to be back to its 2% target, this implies a real rate of just 0.5%. This is unrealistically low in my view. The long-term average of the real fed funds rate, from the 1950s to the eve of the global financial crisis (GFC), was about 2% (deflated by the contemporaneous headline Consumer Price Index CPI).1 Once inflation settles at 2%-2.5% on average, this would suggest a nominal fed funds rate of at least 4%-4.5%. And indeed, back in 2012, the FOMC’s “dot plot” forecast indicated a long term fed funds rate of 4%-4.5%.
During the following years, dominated by zero-interest rate policy and massive rounds of quantitative easing, the Fed, together with most economists and market participants, came to believe that interest rates would be extremely low for the foreseeable future. This was the “Secular Stagnation” hypothesis, which Harvard’s Larry Summers popularized in 2013. It maintained that a structural shift driven by demographics, inequality and the accumulation of assets by central banks and sovereign wealth funds had brought about a new era of excess savings that would keep interest rates permanently depressed. Econometric analyses also suggested that the equilibrium real interest rate, dubbed r*, had declined to about 0.5% post GFC from a previous level of about 2.5%. The Secular Stagnation hypothesis held sway for a long time: Larry Summers emphasized it again in 2020 and Olivier Blanchard early this year.
An important implication was that governments would be crazy not to deficit-spend more, since they could borrow pretty much for free. And borrow they did: US federal debt held by the public jumped from 35% of gross domestic product (GDP) in 2007 to about 100% today. Lower interest rates kept the cost of debt servicing low—net interest outlays as a share of GDP were essentially the same in 2020 as in 2007, even though the debt stock had tripled.
Confidence that interest rates would stay low forever perhaps made it also seem less important to extend the maturity of government debt; close to 70% of the US government debt stock has a maturity of less than five years.2
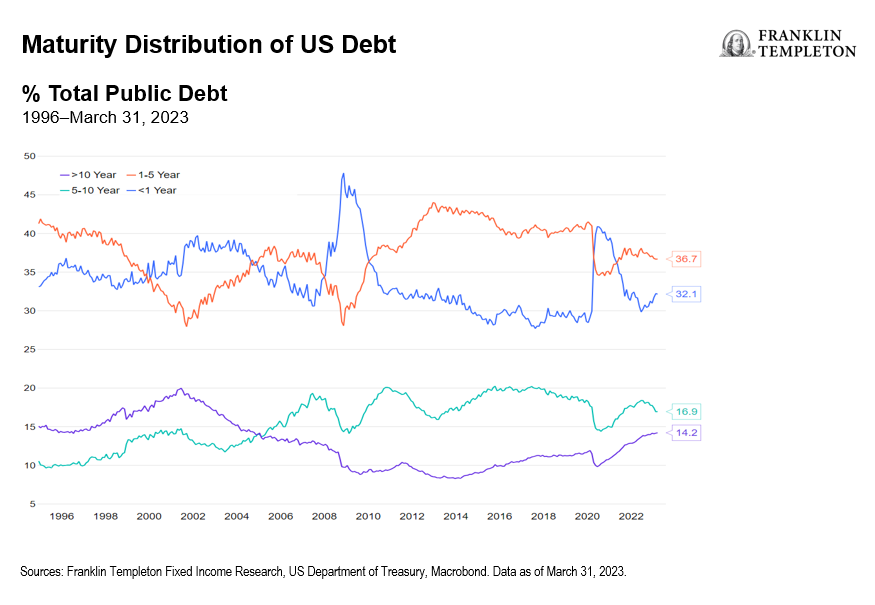
Now, it looks like the decline in bond yields was not a structural shift after all, but rather the temporary impact of the post-GFC slump and the massive central bank intervention to keep rates low. And so now we have a problem: a massive (and rising) debt stock, nearly three quarters of which needs to be rolled over within the next five years, most likely at higher rates.
How high? I have argued above that short-term policy rates seem most likely to settle at 4%-4.5%. Market observers are beginning to acknowledge the idea that r*, the equilibrium real interest rate, is significantly higher than 0.5%. One simple observation is the ongoing strength of the economy. The nominal fed funds is currently at 5.25%-5.50%, which with headline inflation a bit over 3%, gives a real rate of about 2%. If the equilibrium real rate were just 0.5%, this would make monetary policy very tight, which should cause the economy to slow sharply. If instead the equilibrium real rate is around 2%, that would imply that monetary policy is just about on a neutral setting, which seems much more consistent with the resilience of the economy.
If short-term rates settle at 4%-4.5%, then adding a term premium of at least one percentage point (the historical norm is in the 100-150 basis-point [bp] range) would give us a fair value for longer- term US Treasury yields of 5.0%-5.5%. Technical considerations will most likely impose a ceiling—in particular, long-term yields in other advanced economies are likely to remain significantly lower. But US Treasury long term yields close to 5% are not at all unrealistic, in my view.
The above scenario is for the longer term, when the economy settles down with growth on an even keel and inflation stable at 2%. We are not there yet, and the Fed in my view is likely to keep rates at the current level through the remainder of this year and well into 2024. If you add a one percentage-point term premium, that could push the fair value above 6%,—though again, technical factors will likely keep it well below that.
Yields are unlikely to reach those levels this time around, given that risks are tilted toward a weakening economy. But we should at least see a less extreme inversion of the yield curve. Before the last three recessions (1991, 2002 and the GFC) the yield curve inverted by an average of about 40 bps, which would still give us a 10-year Treasury rate close to 5%.
Fiscal headaches
Now, let’s consider the fiscal outlook.
The United States continues to run a very loose fiscal policy, which will need to be financed with greater bond issuance. According to Congressional Budget Office (CBO) projections, the fiscal deficit will expand from about 5% last year to about 6% in 2023, and this does not yet account for the impact of the latest student loan relief initiative.3
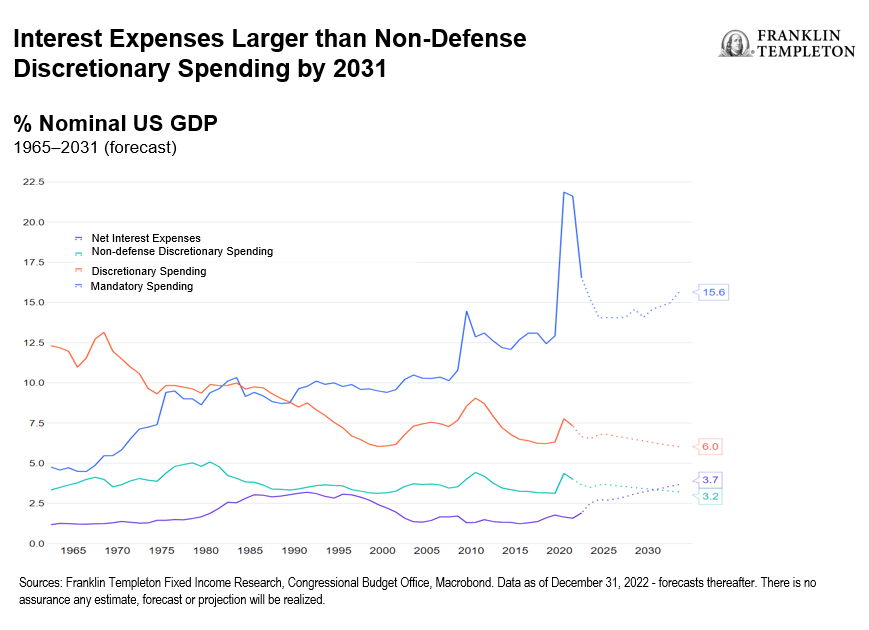
This is just the beginning. Looking further out, rising mandatory spending (notably social security and health care) and rising interest costs, will bloat the US budget, amid higher interest rates and a larger debt stock. The CBO projects net interest outlays to rise from 2.5% of GDP this year to 3.7% of GDP by 2033. This would drive the fiscal deficit to about 6.5 % of GDP. To put things in perspective, in the CBO projections by 2031 interest expenditures would be larger than total non-defense discretionary expenditures.
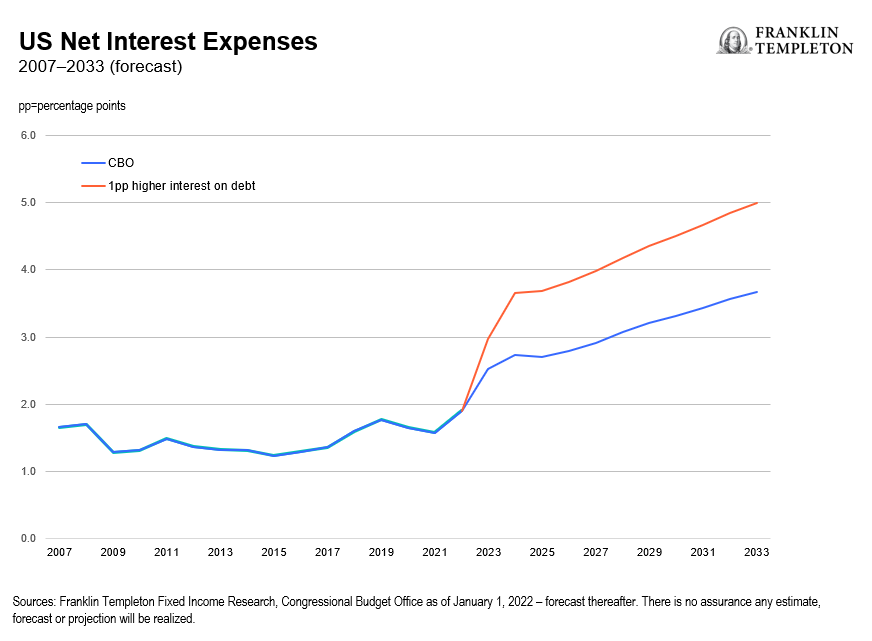
Note that the CBO’s projections of interest payments on the debt are probably optimistic. The CBO assumes that the average interest rate on the debt will be about 3% over the next 10 years, with 10-year US Treasury yields holding below 4%. As I have argued above, this assumption seems extremely unrealistic, so let’s stress-test it.
The average maturity of US debt currently is about 5.5 years. The yield on five-year US Treasuries averaged about 3.85% so far this year, whereas the CBO assumes an average interest rate on the debt of just 2.6% for 2023. Let’s be generous, and assume that the rollover of debt results in the average interest rate being only 0.5 percentage point higher than the CBO assumptions this year, and then one full percentage point higher for the next 10 years.
Under these assumptions, next year interest expenditures would already be one percentage point higher than the CBO projects. For simplicity, I assume that the additional interest expenses feed one for one into an increase in the debt level compared to the CBO debt projections.4
By 2033, interest spending would be 5% of GDP, almost 1.5 percentage points higher than in the CBO baseline. The fiscal deficit would reach 8.6% of GDP in 2033 compared to 7.3 % of GDP in the CBO projections.
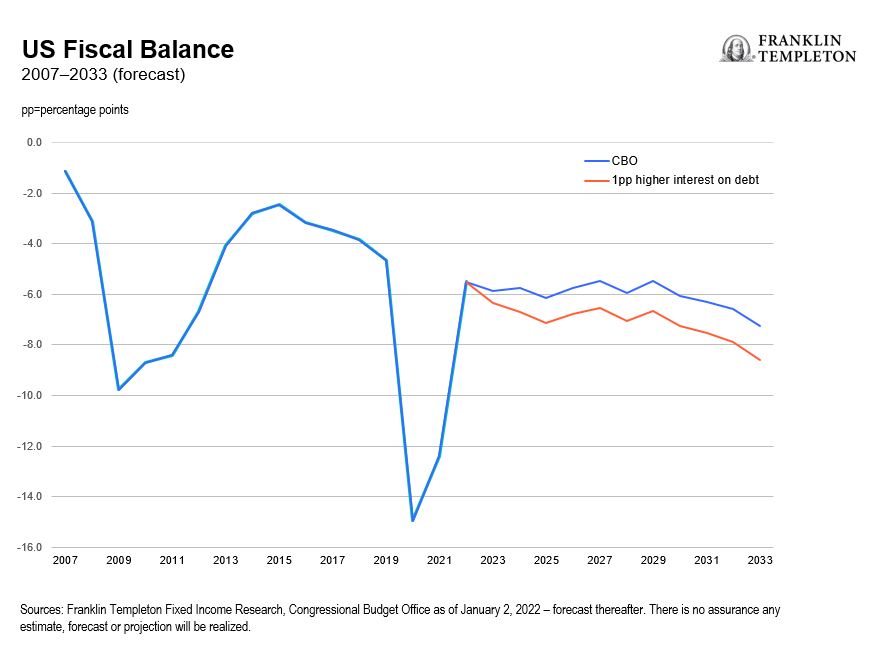
Note the vicious spiral at work. Higher interest rates increase the deficit through higher debt servicing costs, failing serious cuts in spending or tax hikes—both of which seem unlikely in the current political environment. A one percentage-point higher interest rate on the debt than what the CBO assumes appears very realistic at this stage, so this scenario is not far-fetched; the interest rate on the debt would average just under 4% in the next decade, still one percentage point lower than in the decade prior to the GFC. And a large and rising fiscal deficit in turn would push up the term premium, by increasing the perceived credit risk of longer-term debt.
The policy turn in Japan, where the Bank of Japan has shifted to allow some more upside on Japanese bond yields, would also put pressure on US yields by reducing the relative attractiveness of US Treasuries for Japanese investors.
The misjudged confidence that we had entered a brave new era of low interest rates is costing us dearly now—first through a period of high inflation and now through persistent pressure on a government budget that already has precious little room for maneuver. The new monetary policy framework that the Fed adopted three years ago exactly to deal with the supposed structural shift into Secular Stagnation has probably exacerbated the damage.
This time around at Jackson Hole, policymakers would do well to remember that structural shifts need to be assessed with a critical pinch of salt, and a bias toward prudent policymaking outside of extreme emergency would probably be wise.
Investment implications
This long-term analysis has some important implications for investors. The first is that fixed income can now again become a meaningful source of, well, income for an extended period of time, rather than a bet on a new round of capital gains triggered by a sharp fall in yields. The arguments developed above indicate that bond yields are likely to remain elevated as the economy settles back into a new normal, which we believe should look a lot like the old normal that we experienced prior to the GFC.
The second takeaway is that markets have not yet fully acknowledged that there is a limited downside to yields even in the next downturn. When the economy next slides into recession, the Fed will of course cut interest rates, but we should not expect a quick reversal to the zero-interest rate policy of the past decade.
Finally, investors should be mindful that uncertainty on the fiscal policy outlook has increased significantly. We have seen above that if interest rates on the debt are even just one percentage point higher than the CBO assumes, the fiscal deficit will keep rising, averaging over 7% of GDP over the next decade. At some point, this will likely trigger corrective action on expenditures, or taxes, or both. We believe investors should be ready to assess and react to the impact of fiscal policy shifts both on the macro environment and on individual sectors.
WHAT ARE THE RISKS?
All investments involve risks, including possible loss of principal.
Equity securities are subject to price fluctuation and possible loss of principal.
Fixed income securities involve interest rate, credit, inflation and reinvestment risks, and possible loss of principal. As interest rates rise, the value of fixed income securities falls. Low-rated, high-yield bonds are subject to greater price volatility, illiquidity and possibility of default.
IMPORTANT LEGAL INFORMATION
This material is intended to be of general interest only and should not be construed as individual investment advice or a recommendation or solicitation to buy, sell or hold any security or to adopt any investment strategy. It does not constitute legal or tax advice. This material may not be reproduced, distributed or published without prior written permission from Franklin Templeton.
The views expressed are those of the investment manager and the comments, opinions and analyses are rendered as at publication date and may change without notice. The underlying assumptions and these views are subject to change based on market and other conditions and may differ from other portfolio managers or of the firm as a whole. The information provided in this material is not intended as a complete analysis of every material fact regarding any country, region or market. There is no assurance that any prediction, projection or forecast on the economy, stock market, bond market or the economic trends of the markets will be realized. The value of investments and the income from them can go down as well as up and you may not get back the full amount that you invested. Past performance is not necessarily indicative nor a guarantee of future performance. All investments involve risks, including possible loss of principal.
Any research and analysis contained in this material has been procured by Franklin Templeton for its own purposes and may be acted upon in that connection and, as such, is provided to you incidentally. Data from third party sources may have been used in the preparation of this material and Franklin Templeton (“FT”) has not independently verified, validated or audited such data. Although information has been obtained from sources that Franklin Templeton believes to be reliable, no guarantee can be given as to its accuracy and such information may be incomplete or condensed and may be subject to change at any time without notice. The mention of any individual securities should neither constitute nor be construed as a recommendation to purchase, hold or sell any securities, and the information provided regarding such individual securities (if any) is not a sufficient basis upon which to make an investment decision. FT accepts no liability whatsoever for any loss arising from use of this information and reliance upon the comments, opinions and analyses in the material is at the sole discretion of the user.
Products, services and information may not be available in all jurisdictions and are offered outside the U.S. by other FT affiliates and/or their distributors as local laws and regulation permits. Please consult your own financial professional or Franklin Templeton institutional contact for further information on availability of products and services in your jurisdiction.
Issued in the U.S. by Franklin Distributors, LLC, One Franklin Parkway, San Mateo, California 94403-1906, (800) DIAL BEN/342-5236, franklintempleton.com – Franklin Distributors, LLC, member FINRA/SIPC, is the principal distributor of Franklin Templeton U.S. registered products, which are not FDIC insured; may lose value; and are not bank guaranteed and are available only in jurisdictions where an offer or solicitation of such products is permitted under applicable laws and regulation.
________________________
1. Source: US Federal Reserve, Bureau of Labor Statistics, as of August 10, 2023.
2. Source: Federal Reserve Bank of St. Louis “Assessing the Costs of Rolling Over Government Debt” as of June 2, 2023.
3. Source: US Congressional Budge Office: The Budget and Economic Outlook 2023 to 2033, as of 2/2023. There is no assurance that any estimate, forecast or projections will be realized.
4. A technical note: in standard debt dynamics formulations, the fiscal deficit feeds directly into the debt stock. Here however we are looking at debt held by the public, which excludes intragovernmental debt, mostly held by Social Security trust funds. The CBO’s projections for debt held by the public include assumptions on how much federal debt will be bought or sold by these trust funds; as a consequence, in the CBO projections debt held by the public rises much more slowly than the deficit path would imply. For ease of comparison we therefore maintain the CBO implicit assumptions on intragovernmental debt. There is no assurance that any estimate, forecast or projection will be realized.